Financial Modeling for Tech Startups
By Lior Ronen | Founder, Finro Financial Consulting
Financial modeling or planning are fundamental for every business. But for tech startups, it’s a must.
It’s the master plan that holds everything the business knows and expects about generating revenue, acquiring clients and growing.
It's like a blueprint to your business that shows the components, drivers, inputs, outputs, calculations, and everything remotely realted to growing the business.
When used wisely, a finanical model goes way beyond the numbers. It's a tool that helps you make good decisions and attract people who want to invest in your business.
In this article, we'll try to explain financial modeling from start to finish.
You'll find out how to create a plan that shows how much money you might make and where your money will go. This will help you make smart choices and get the money you need to grow your business.
This article will not make you a pro finanical modeler, BUT, you’ll understand the core conepts of startup financial modeling and how to use numbers and plans to tell a story about how your business can succeed.
So, are you ready to learn how to use this map to make your business successful?
- Startup financial modeling is the process of creating a detailed spreadsheet to forecast a startup's financial performance and guide its business decisions.
- It is vital for tech startups, guiding strategic decisions, financial health, resource allocation, and funding efforts.
- A robust financial model for tech startups combines revenue forecasts, cost structure analysis, cash flow, and balance sheet management.
- Implementing effective financial modeling techniques like scenario analysis and benchmarking is key for informed decision-making and successful fundraising in tech startups.
- What is a Startup Financial Model?
- Essential Elements of a Tech Startup Financial Model
- Revenue Projections
- Key Factors Influencing Revenue Projections
- Cost of Revenues or Cost of Goods Sold (COGS)
- Operating Expenses: Payroll
- Operating Expenses: Non-Payroll Expenses
- Building the Income Statement
- Cash Flow Projections
- Balance Sheet Projections
- Key Performance Indicators (KPI)
- Breakeven Analysis
- Scenario Analysis and Sensitivity Testing
- Benchmarking and Industry Comparisons
- Using Assumptions and Historical Data
- Regular Review and Iteration
- Common Pitfalls and How to Avoid Them
- Benefits of Choosing Finro As Your Startup Financial Modeling Consultant
- Conclusion
What is a Startup Financial Model?
A startup financial model provides a comprehensive overview of a startup's financial performance and future projections. It typically includes detailed forecasts of income, expenses, cash flow, and other relevant financial data.
This model serves as a quantitative representation of a startup's business plan, helping founders to visualize their company's financial future.
Founders leverage financial models during fundraising to communicate their startup's financial health and prospects to potential investors.
The model provides a clear picture of anticipated revenues, costs, and the path to profitability, which is essential for convincing investors of the startup's potential for success. It also serves as a critical tool in discussions with banks, venture capitalists, and other stakeholders, offering transparency into the startup's financial state and forecasts.
Financial models are pivotal for strategic decision-making within a startup. They allow founders to simulate various scenarios, analyze the financial impact of different strategic choices, and identify the most viable paths for growth and scalability.
By assessing factors such as market size, pricing strategies, and cost structures, founders can make informed decisions that align with their business objectives.
A startup financial model aids in establishing and tracking Key Performance Indicators (KPIs). These KPIs, which might include metrics like customer acquisition cost, lifetime value, burn rate, and revenue growth, provide measurable insights into the startup's performance. Regularly reviewing these metrics helps founders to monitor progress, adjust strategies as necessary, and stay aligned with their business goals.
A Key Performance Indicator (KPI) is a measurable value that indicates how effectively a company is achieving key business objectives. KPIs are used at multiple levels to evaluate success in reaching targets. High-level KPIs focus on overall performance of the business, while low-level KPIs target processes in departments such as sales, marketing, HR, support, and others. They provide critical insights into various aspects of an organization's performance, allowing for informed decisions and strategic planning.
Read more
Get your expert financial model now!
The utilization of financial models varies between early-stage and late-stage startups. In early stages, the model is often used to explore market potential and validate the business concept, with a focus on survival and achieving product-market fit.
For late-stage startups, the model becomes more sophisticated, emphasizing optimization, scaling strategies, efficiency, and profitability. The complexity and accuracy of financial projections typically increase as the startup matures.
Investor Perspective Investors use startup financial models to assess the viability and potential return on investment of a startup.
They scrutinize the model to understand the startup's growth trajectory, evaluate the realism of its projections, and identify potential risks and opportunities. Investors also use these models to compare startups against industry benchmarks and make informed decisions about where to allocate their capital.
In the next section, we’ll introduce the essential elements a financial model for a tech startup should include. In the following sections, we’ll break these elements down, dive deeper into each one, and build a comprehensive picture of a startup financial model.
| Aspect | Early-Stage Startup Financial Model | Late-Stage Startup Financial Model |
|---|---|---|
| Focus | Validating the business concept, market potential, and product-market fit. | Optimization, scaling strategies, efficiency, and profitability. |
| Complexity | Generally simpler, focusing on basic revenue and cost structures. | More sophisticated, including detailed revenue streams, cost analysis, and financial projections. |
| Revenue Projections | Often based on assumptions and market research due to limited historical data. | Based on extensive historical data, with more accurate and diversified projections. |
| Cost Analysis | Focus on initial setup, operational costs, and basic budgeting. | Comprehensive analysis of all operational, marketing, and development costs. |
| Risk Assessment | High emphasis on identifying and mitigating initial market and product risks. | Focus on long-term sustainability, market competition, and operational risks. |
| Funding Strategy | Primarily aimed at securing initial seed or angel investments. | Targeted towards larger scale funding rounds, mergers, or public offerings. |
| Key Metrics | Customer acquisition cost, burn rate, early-stage growth indicators. | EBITDA, cash flow, return on investment, market share metrics. |
Essential Elements of a Tech Startup Financial Model
As discussed, financial modeling is a critical tool for tech startups, enabling them to navigate industry complexities, allocate resources efficiently, make informed decisions, and secure vital funding. A well-designed financial model empowers tech entrepreneurs to gain a deeper understanding of their business's financial performance and chart a course towards sustainable success.
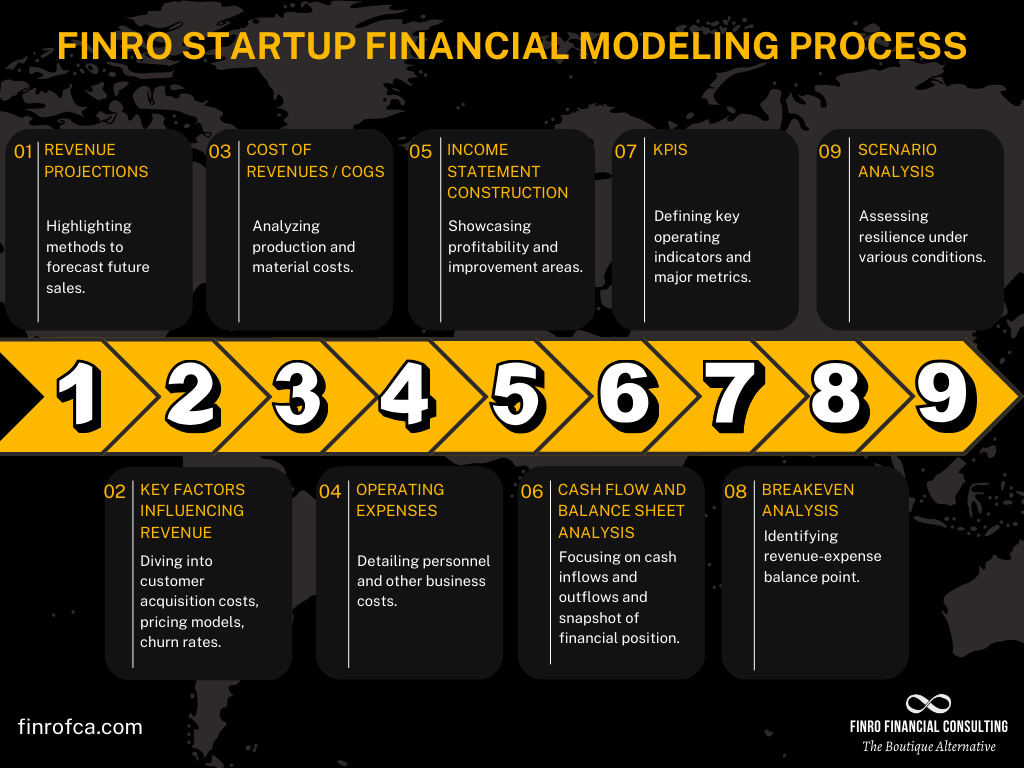
To achieve this, incorporating key components that capture the unique aspects and dynamics of the tech industry into your financial model is crucial. Here are seven essential elements, representing a comprehensive framework for building an effective financial model:
1. Revenue Projections: Accurately forecasting future revenue is vital for any business. This section analyzes historical data, market trends, and competitive landscape to project future sales and set realistic expectations.
2. Key Factors Influencing Revenue Projections: Understanding the key drivers of revenue is crucial for refining your projections. This section delves into factors like customer acquisition costs, pricing models, and churn rates to ensure your revenue estimates are based on sound assumptions.
3. Cost of Revenues or Cost of Goods Sold (COGS): Accurately calculate the cost of delivering your product or service. This section analyzes costs associated with production, materials, and other direct expenses that directly impact your profitability.
4. Operating Expenses: Payroll: Estimate your personnel costs, including salaries, benefits, and payroll taxes. This section ensures you accurately account for a significant expense category in your financial model.
5. Operating Expenses: Non-Payroll Expenses: Identify and forecast all other non-payroll operating expenses. This may include rent, marketing, legal fees, and other essential business costs.
6. Building the Income Statement: Compile all revenue and expense projections to create the income statement. This statement provides a clear picture of your profitability and helps you identify areas for improvement.
7. Cash Flow Analysis: Understand your cash flow, the lifeblood of any business. This section analyzes the timing of your cash inflows and outflows, ensuring you have sufficient liquidity to operate and grow.
8. Balance Sheet Items: Project your assets, liabilities, and shareholder equity. This section provides a snapshot of your financial position at a specific point in time.
9. Key Performance Indicators (KPIs): Define key metrics that reflect your business's health and performance. This section establishes benchmarks for measuring progress and identifying areas for improvement.
10. Breakeven Analysis: Determine the point at which your revenue equals your expenses. This analysis helps you set realistic targets and understand your financial runway.
11. Scenario Analysis: Test your financial model under different assumptions and market conditions. This section allows you to assess your business's resilience and identify potential risks and opportunities.
The following sections delve deeper into each component, providing detailed explanations and examples to guide you through the process of building a robust financial model for your tech startup.

Revenue Projections
Forecasting revenue is essential for startup founders, and there are two primary forecasting models to choose from: top-down and bottom-up forecasts. Each method has its unique strengths and is applicable depending on the specific stage and situation of the startup.
Ideal for early-stage startups, the top-down forecast, or the TAM-SAM-SOM model, helps assess market potential and present opportunities to investors.
In contrast, the bottom-up forecast zeroes in on distinct customer segments, pricing structures, and sales channels, providing a more accurate and comprehensive revenue prediction for startups that have already achieved a product-market fit.
Let’s dive right in.
Revenue Forecasting Method #1: Top-Down
Top-down forecasting is a market sizing approach that starts with a broad view of the market and then narrows down to your startup's specific target market. It is a simple and quick way to estimate your market potential, but it can be less accurate than bottom-up forecasting, which builds up from your startup's internal capabilities.
The top-down forecasting process typically follows these steps:
Estimate the Total Addressable Market (TAM), which is the maximum revenue opportunity if your product or service captured the entire market.
Refine the TAM to the Serviceable Available Market (SAM), which is the portion of the TAM that your startup can realistically target based on its current resources, reach, and abilities.
Establish the Serviceable Obtainable Market (SOM), which is the share of the SAM that your startup can realistically achieve in the short to medium term.
Top-down forecasting is often used by early-stage startups to gauge market potential and confirm the viability of their business concepts. It is also used by mature businesses looking to penetrate a new market and assess the size of the opportunity at a high level.
However, it is important to note that top-down forecasts can sometimes lean towards optimism, as they can be based on assumptions that may not be realistic. Therefore, it is important to pair top-down forecasts with a more thorough, bottom-up analysis.

Revenue Forecasting Method #2: Botton-Up
Bottom-up forecasting is a market sizing approach that starts with your startup's internal capabilities and builds up to your overall revenue potential.
It is a more complex and time-consuming approach than top-down forecasting, but it can be more accurate, especially for startups that have already achieved product-market fit.
The bottom-up forecasting process typically follows these steps:
Identify your startup's distinct customer segments.
Estimate the number of potential customers in each segment.
Determine your startup's conversion rate, which is the percentage of potential customers who actually become paying customers.
Estimate your startup's average revenue per customer (ARPC).
Multiply the number of potential customers in each segment by your conversion rate and ARPC to calculate the revenue potential for that segment.
Sum the revenue potential for each segment to calculate your startup's total revenue potential.
Average Revenue Per Customer (ARPC) is a financial metric used to assess the average income generated from each customer over a specific period. It is calculated by dividing the total revenue earned in a given period by the total number of customers during the same period.
This metric is particularly useful for businesses to understand the value derived from their customer base, evaluate the effectiveness of their pricing strategy, and identify opportunities for revenue growth. It's a key indicator in financial modeling and forecasting, especially for companies focusing on customer-centric growth strategies.
Read more
Bottom-up forecasting is particularly useful for startups that:
Have achieved a product-market fit, as it offers a more precise and extensive revenue prediction.
Possess historical data on customer acquisition, churn rates, and conversion rates, as it enables a more accurate projection of future revenue.
Have a clear monetization plan and business model.
Aim to identify areas for enhancement, fine-tune sales and marketing tactics, and set more achievable growth objectives.
| Aspect | Top-Down Forecasting | Bottom-Up Forecasting |
|---|---|---|
| Starting Point | Begins with a broad market view, narrowing down to the startup's target market | Starts from the startup's internal capabilities and builds up |
| Complexity & Time | Simpler and quicker to execute | More complex and time-consuming |
| Accuracy | Less accurate, often optimistic | Generally more accurate, especially for startups with product-market fit |
| Process Steps | 1. Estimate TAM 2. Refine to SAM 3. Establish SOM |
1. Identify customer segments 2. Estimate potential customers per segment 3. Determine conversion rates 4. Estimate ARPC 5. Calculate revenue per segment |
| Ideal Use | Early-stage startups assessing market potential; mature businesses exploring new markets | Startups with product-market fit; those with historical data and a clear monetization plan |
| Focus | Market potential and viability of business concepts | Precise revenue prediction, sales and marketing strategies, growth objectives |

Key Factors Influencing Revenue Projections
Revenue projections are essential for any business, but they are especially important for tech startups.
Tech startups often have high growth potential, but they also face significant competition and uncertainty.
As a result, it is important to carefully consider all of the factors that can influence revenue projections.
Customer Segments and Pricing Models
One of the most important factors to consider is your target customer segments.
What are their needs and preferences? What are they willing to pay for your product or service? Once you understand your target customers, you can design appropriate pricing models. There are a variety of pricing models that tech startups use, including subscription-based pricing, freemium pricing, and tiered pricing.
To estimate the potential revenue from each customer segment, you need to consider factors such as market size, customer acquisition costs, and conversion rates. Market size refers to the total number of potential customers in your target market. Customer acquisition costs are the costs associated with acquiring new customers. Conversion rates are the percentage of potential customers who actually become paying customers.
Customer Acquisition Cost (CAC) is a key business metric that measures the total cost of acquiring a new customer. It includes all sales and marketing expenses over a specific period, divided by the number of new customers acquired in that period. CAC is crucial for understanding the effectiveness of marketing strategies and evaluating the cost-effectiveness of acquiring customers. It helps businesses determine how much they are spending to gain a single customer, which is essential for assessing the profitability and scalability of their business models.
Read more
Sales Channels and Growth Drivers
Another important factor to consider is your sales channels. How will you reach your target customers? Will you sell directly through your website? Will you use partners or resellers? Will you use digital marketing channels like search engine optimization (SEO) and pay-per-click (PPC) advertising?
Once you have identified your sales channels, you need to understand the growth drivers for each channel. For example, if you are using digital marketing, you need to consider the number of leads you are generating, your conversion rates, and your average deal sizes.
Churn Rates and Customer Lifetime Value
If you offer a subscription-based service, it is important to understand your churn rate.
The churn rate is the percentage of customers who cancel their subscriptions in a given period of time. A high churn rate can significantly reduce your revenue potential.
You can use historical data to determine your average churn rate and identify trends that may impact future performance. For example, if you see that your churn rate is increasing, you need to investigate the reasons and take steps to address them.
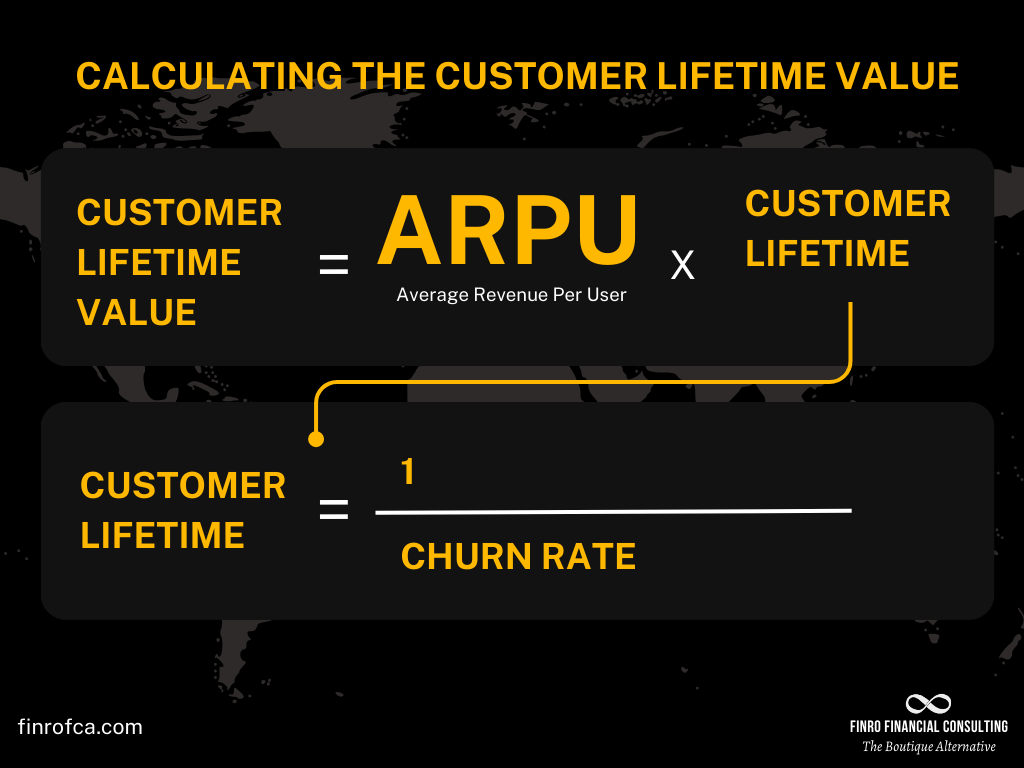
In addition to the churn rate, it is also essential to calculate your customer lifetime value (LTV). LTV is the average revenue you expect to generate from a customer over the lifetime of their relationship with your company.
To calculate LTV, you need to consider factors such as your average revenue per user (ARPU), customer acquisition cost (CAC), and customer lifespan.
Understanding your churn rate and LTV can help you gauge the long-term revenue potential from each customer segment and inform your marketing and sales strategies.
Average Revenues Growth Rate For Startups
Navigating the journey from a nascent startup to a sustainable business is a marathon, not a sprint, requiring years of steadfast commitment.
A pivotal aspect of this journey involves understanding and projecting revenue growth—essential not just for internal planning but also for attracting investment.
Founders often grapple with the challenge of how to present revenue forecasts: pitch too high, and credibility is questioned; too conservative, and investor interest wanes.
The quest for reliable benchmarks on expected revenue growth has been hampered by a general scarcity of data on startups' financial projections.
However, Equidam, leveraging its valuation platform, has shed some light on this area.
Analyzing financial projections from a sample of over 25,000 early-stage ventures worldwide, Equidam provides a glimpse into the growth expectations set by founders, who are incentivized to offer realistic forecasts to secure fair valuations.
Benchmarks for Estimating Startup Growth Rates
The crux of forecasting for startups lies in determining a plausible growth rate. This rate is crucial regardless of a company's initial scale, serving as a foundation for both the startup's valuation and its narrative of future success.
The analysis dives into the most recent year-to-date financials and extends to three years of projected revenue growth, offering a comprehensive view of expected annual revenue growth rates.
Based on this extensive dataset, the average startup anticipates a formidable growth trajectory: a 268% revenue increase in the first year, followed by 144% in the second year, and 71% in the third year. These figures not only underscore the ambitious growth targets set by startups but also highlight the steep growth curve that founders and investors alike aspire to achieve.
This section aims to equip founders with the insights needed to your their growth strategies and investor pitches, and put your forecasts in perspective. The next sections will dive into the other sections of the financial model, such as COGS, gross margin, cash flow, KPIs, and more.

Cost of Revenues or Cost of Goods Sold (COGS)
Cost of goods sold (COGS) and Cost of Revenues are financial metrics that measure the direct costs associated with producing and delivering goods or services. While COGS focuses specifically on production costs, the Cost of Revenues encompasses a broader range of expenses related to generating revenue.
Cost of Goods Sold (COGS)
Cost of Goods Sold (COGS) is a financial metric that captures the direct costs incurred in producing goods or providing services. These costs typically include raw materials, direct labor, and manufacturing overheads.
COGS is a key component of the income statement and is used primarily by manufacturing and product-based companies to calculate gross profit. By subtracting COGS from total revenue, businesses can determine their gross profit, which indicates the profitability of their core operations before accounting for indirect costs such as administration, marketing, and other expenses.
Examples of businesses using COGS:
Hardware Manufacturers: Companies like Apple and Dell that design, manufacture, and sell computer hardware, smartphones, and other electronic devices primarily use COGS in their financial reporting. Their COGS includes the costs of raw materials, direct labor, and manufacturing overheads associated with producing these products.
Semiconductor Companies: Companies such as Intel and NVIDIA, which manufacture and sell semiconductor chips and processors, also use COGS to measure the direct costs of producing their products. These costs include materials, labor, and fabrication facility expenses.
Gross profit is the total revenue of a company minus the cost of goods sold (COGS), which includes the direct costs of producing the goods or services sold. Gross margin, expressed as a percentage, is the gross profit divided by the total revenue. It represents how much a company earns from each dollar of sales after covering the direct costs of producing its goods or services. Gross margin is a key indicator of a company's production efficiency and profitability.
Read more
Cost of Revenues
Cost of Revenues, on the other hand, is a more comprehensive metric that includes not only the direct costs of producing goods or services (COGS) but also any additional costs related to delivering the product or service to the customer.
These additional costs may include sales commissions, shipping, and credit card processing fees. Cost of Revenues is used by both product-based and service-based companies to represent their business operations and revenue streams better.
Like COGS, Cost of Revenues is a line item on the income statement, and subtracting it from total revenue yields the gross profit, offering insight into the company's overall profitability before accounting for indirect expenses.
Examples of businesses using the Cost of Revenues:
Software-as-a-Service (SaaS) Companies: SaaS companies like Salesforce and Adobe provide software solutions on a subscription basis. They use Cost of Revenues to capture not only the direct costs of developing and maintaining their software but also additional expenses related to delivering the service, such as cloud infrastructure costs, customer support, and sales commissions.
E-commerce Companies: Online retailers like Amazon and eBay use Cost of Revenues to account for the costs associated with selling and delivering products on their platforms. In addition to the direct costs of acquiring or producing goods, these companies also incur costs such as payment processing fees, shipping and handling expenses, and commissions for third-party sellers.
Online Streaming Services: Companies like Netflix and Spotify, which provide online streaming services for video and music content, use Cost of Revenues in their financial reporting. Their Cost of Revenues includes expenses such as content acquisition and licensing, content delivery network (CDN) costs, and customer support.
| Aspect | Cost of Goods Sold (COGS) | Cost of Revenues |
|---|---|---|
| Definition | Direct costs incurred in producing goods or services | Direct costs of producing & delivering goods or services |
| Scope | More specific, focused on direct production costs | Broader, includes COGS & other related expenses |
| Financial Reporting | Line item on the income statement | Line item on the income statement |
| Used by | Manufacturing & product-based companies | Product-based & service-based companies |
| Calculation | Total Revenue - COGS = Gross Profit | Total Revenue - Cost of Revenues = Gross Profit |
Typical Gross Margin for SaaS Businesses
Having explored the dynamics of revenue and costs of revenues in tech startups, we now focus on the gross profit margin.
This pivotal metric encapsulates the outcomes of our prior discussions and serves as a key indicator of a company's operational efficiency and strategic direction in the SaaS sector.
It highlights the essential balance between income and expenditure, laying bare the core of a company's financial health and its standing in the competitive digital marketplace.
This metric, which calculates the percentage of revenue that exceeds the cost of goods sold (COGS), is pivotal for assessing a SaaS company's profitability, scalability, and sustainability.
Understanding Gross Profit Margin
Simply put, the gross profit margin measures how much of each dollar of revenue a company retains as gross profit after accounting for the direct costs of producing its services.
For example, if a SaaS company generates $1 million in revenue with COGS of $400,000, its gross profit is $600,000, resulting in a 60% gross profit margin. This reveals that 60% of revenue contributes to covering other expenses or adding to net profit, highlighting operational efficiency.
Importance in the SaaS Industry
Gross margin is crucial in the SaaS industry due to the sector's unique cost structure and revenue generation model. High margins indicate efficient cost management and a scalable business model, essential for growth and sustainability in the competitive tech landscape.
Startups in this space aim for margins between 70% and 90%, with the industry average around 76%, underscoring the model's inherent efficiency and the low incremental cost of adding customers.
Strategic Implications and Investor Interest
High gross profit margins not only signal strong financial health but also attract investor interest, as they suggest a company is well-positioned for sustainable growth and competitive advantage. These margins are influenced by operational efficiencies, pricing strategies, and market positioning, highlighting the need for SaaS companies to optimize their operations to maintain competitive edges in the digital economy.
Conclusion
In summary, the gross profit margin is indispensable for gauging a SaaS company's health and prospects. It reflects operational efficiency, scalability, and the ability to sustain long-term success in a rapidly evolving tech market.
Understanding and optimizing this metric is crucial for SaaS businesses aiming to thrive and lead in their industry, making it a vital focus for stakeholders.

Operating Expenses: Payroll
When projecting operating expenses for your tech startup, it's essential to differentiate between payroll and non-payroll expenses to project your startup's expenses accurately.
Payroll forecasting is a critical aspect of financial planning for any startup, particularly in the tech sector where staffing needs can rapidly evolve. This process is not just a simple multiplication of headcount by salary; it involves a multi-step approach to accurately project future payroll expenses.
The primary steps include mapping current headcount, projecting future personnel requirements based on the product roadmap, estimating the timing and number of new hires, and considering both direct and indirect impacts of expanding the company's headcount and offerings.
The initial phase in payroll forecasting involves a thorough analysis of the existing staff, categorized by their roles and functions such as customer support, product development, sales and marketing, and general administration.
This categorization aids in understanding the current state of the business and sets the foundation for future projections. The next step is aligning the forecast with the company's product roadmap, identifying how upcoming milestones, features, or products will affect staffing needs.
A product roadmap is a strategic plan that outlines the vision, direction, priorities, and progress of a product over time. It serves as a guiding document for product development, setting clear goals and milestones. A roadmap helps align the team and stakeholders on the product's future development path, ensuring everyone is working towards common objectives. It typically includes timelines, features, enhancements, and key deliverables, and is often used to communicate the product's evolution to internal teams and external partners.
Read more
This step is crucial as it influences not just the product development team but can have broader implications across sales, marketing, and support functions.
As the forecast progresses, it's essential to estimate the direct and indirect headcount impacts. Direct impact involves immediate staffing needs for new projects or features, while indirect impact could include additional support or administrative roles necessitated by overall company growth.
This holistic approach ensures that all aspects of headcount expansion are considered.
Finally, the forecast is refined by calculating the total payroll expense per employee, including base salary, bonuses, stock-based compensation, annual increases, and sales commissions.
Employer's taxes, often overlooked, are also added to provide a complete picture of the total payroll expenses.
This comprehensive process not only helps in creating an accurate budget but also in understanding the financial implications of hiring decisions, crucial for a startup's sustainable growth.

Operating Expenses: Non-Payroll Expenses
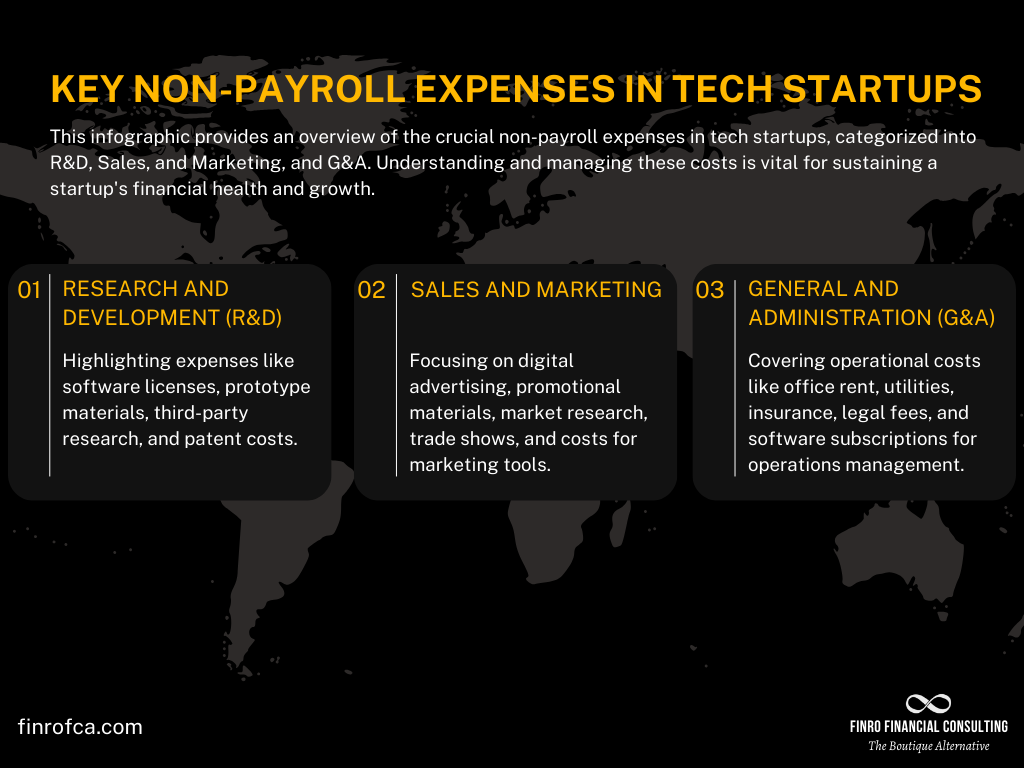
Non-payroll expenses are a significant component of a tech startup's operating costs, encompassing all costs not directly tied to employee salaries or the cost of goods sold (COGS).
These expenses are typically categorized into three main areas: Research and Development (R&D), Sales and Marketing, and General and Administration (G&A).
Research and Development (R&D): This category includes expenses related to the development of new products or services and the improvement of existing ones. Examples of R&D non-payroll expenses include costs for software licenses, prototype materials, third-party research services, and costs associated with patent filing and protection.
These expenses are crucial for tech startups, especially those focused on continual innovation and product development.
Sales and Marketing: Sales and marketing expenses are key for business growth and customer acquisition.
For tech startups, this can involve costs for digital advertising, promotional materials, market research, trade shows, and public relations activities. Additionally, costs for software tools used in marketing, like CRM systems and analytics platforms, also fall under this category.
General and Administration (G&A): This broad category covers the operational costs necessary to run the business but not directly tied to product development or sales.
Examples include office rent, utilities, insurance, legal and professional fees, and software subscriptions for operations management (like accounting and HR systems). These expenses are essential for maintaining the day-to-day functionality and compliance of the startup.
Effectively managing non-payroll expenses is crucial for maintaining financial health and ensuring that resources are allocated efficiently.
Tech startups must carefully balance these costs against their growth objectives and revenue projections to sustain long-term viability.
Building the Income Statement
Creating an income statement for a tech startup involves consolidating various financial elements, including revenues, cost of goods sold (COGS), payroll, and non-payroll expenses. This statement is a crucial tool for analyzing the company's financial performance over a specific period.
Revenue Reporting: The income statement begins with the total revenues, encompassing all income from sales, services, or other business activities, based on the previously established revenue projections.
COGS and Gross Margin: Next, the COGS is subtracted from the total revenue to calculate the gross margin. This figure represents the efficiency of the production process, showing the amount retained from each dollar of sales before considering other expenses.
Operating Expenses: These are then listed, including both payroll expenses (salaries, benefits, taxes) and non-payroll expenses (R&D, Sales and Marketing, and G&A).
Operating Profit (EBIT): Subtracting these operating expenses from the gross margin gives the Operating Profit or Earnings Before Interest and Taxes (EBIT). This metric reflects the profitability from core business operations.
EBITDA Calculation: By adding back non-cash expenses like depreciation and amortization to EBIT, we arrive at EBITDA (Earnings Before Interest, Taxes, Depreciation, and Amortization). EBITDA offers a view of operational profitability, eliminating the effects of accounting and financial decisions.
Net Income: The final step is to calculate the Net Income, which is the remaining profit or loss after all expenses, including interest and taxes, have been deducted from the EBIT.
The income statement thus provides a comprehensive view of a tech startup's financial performance, highlighting not just the net income but also key metrics like gross margin, operating profit, and EBITDA. These insights are vital for stakeholders in evaluating the startup's profitability, operational efficiency, and overall financial health.
| Income Statement Item | Description |
|---|---|
| Total Revenues | All income from sales, services, or other activities. |
| Less: COGS | Direct costs of producing goods or services. |
| Gross Margin | Total Revenues minus COGS. |
| Less: Operating Expenses | Payroll and non-payroll expenses (R&D, Sales and Marketing, G&A). |
| Operating Profit (EBIT) | Gross Margin minus Operating Expenses. |
| Add: Depreciation and Amortization | Non-cash expenses added back to EBIT. |
| EBITDA | Operating Profit plus Depreciation and Amortization. |
| Less: Interest and Taxes | Deductions for interest and tax expenses. |
| Net Income | Final profit or loss after all deductions. |

Cash Flow Projections
Cash flow refers to the movement of money in and out of the business over a specific period of time, representing the net amount of cash generated or used up by a company's operating, investing, and financing activities.
Monitoring cash flow is crucial for businesses, especially startups because it helps them understand their financial health, meet their obligations, manage liquidity, and make informed decisions.
Accurate cash flow projections are essential when building a financial model, as they help startups monitor and manage their liquidity, ensuring they have enough cash on hand to cover operating expenses and meet financial obligations. This is particularly important for startups, as they often experience irregular cash inflows and may require more working capital to support growth.
A positive cash flow indicates that a company's liquid assets are increasing, allowing it to cover expenses, invest in growth, and pay dividends to shareholders. A negative cash flow, on the other hand, signifies that the company is spending more money than it is generating, which could lead to financial difficulties if not addressed.
Additionally, accurate cash flow projections can serve as an early warning system, alerting startups to potential cash shortages or other financial challenges before they become critical.
In order to better understand the different components of cash flow and their significance in a startup's financial model, let's examine a summary of the three main types of cash flow: operating, investing, and financing.
The table below provides an overview of each type, highlighting key considerations for calculating and projecting cash flows in your financial model. By closely monitoring each aspect of cash flow, startups can maintain a strong financial position and make well-informed strategic decisions.
| Type of Cash Flow | Description |
|---|---|
| Operating Cash Flow | Cash generated from core business activities, such as sales revenue, minus cash spent on operating expenses. Consider payment terms, collection periods, cash discounts, incentives, and potential fluctuations due to external factors. |
| Investing Cash Flow | Cash spent or received from non-operating activities like purchasing or selling assets, acquisitions, or investments in research and development. Analyze historical data and future growth plans to estimate investing cash flow. |
| Financing Cash Flow | Cash transactions related to the startup's capital structure, such as issuing or repaying debt, raising equity, or paying dividends. Influenced by market conditions, investor expectations, and regulatory requirements. |
By referring to this table and incorporating these cash flow components into your financial model, you can create a more comprehensive picture of your startup's financial health and ensure that you are prepared to address potential challenges and seize opportunities for growth.

Balance Sheet Projections
A balance sheet is a financial statement that provides a snapshot of a company's financial position at a specific point in time. It presents the company's assets, liabilities, and equity, demonstrating how these elements are interconnected. Assets represent the resources owned or controlled by the company, while liabilities are the financial obligations to other parties. Equity is the residual interest in the company's assets after deducting liabilities and represents the ownership interest of the shareholders.
In short: Assets = Equity + Liabilities.
Balance sheet projection is the process of forecasting a company's future financial position based on historical data, market trends, and assumptions. It involves estimating future changes in assets, liabilities, and equity, allowing companies to evaluate their financial health, manage risk, and make informed decisions about resource allocation, capital structure, and growth strategies.
Early-stage startups often don't need to build a balance sheet projection because they typically have limited assets and liabilities, making their financial position relatively simple.
Additionally, startups usually focus on cash flow projections and income statements, as these financial statements provide more actionable insights into their operational performance, funding needs, and growth potential.
As the startup matures and its financial situation becomes more complex, a balance sheet projection may become more relevant and necessary for effective financial management.
| Category | Type | Description |
|---|---|---|
| Assets | Current Assets | Easily converted into cash or consumed within a year, e.g., cash, accounts receivable, inventory. |
| Non-current Assets | Longer lifespan, e.g., property, plant, equipment, intangible assets (patents, software). | |
| Liabilities | Current Liabilities | Obligations due within a year, e.g., loans, accounts payable, taxes. |
| Non-current Liabilities | Obligations extending beyond a year, e.g., long-term loans. | |
| Equity | Common Stock | Ownership interest of founders and investors, represented by common shares. |
| Preferred Stock | Ownership interest with preferential rights, represented by preferred shares. | |
| Additional Paid-in Capital | Funds received from investors above the par value of shares. | |
| Retained Earnings | Accumulated net income not distributed as dividends, reinvested in the business. |
Key Performance Indicators (KPI)
As a tech startup, monitoring and analyzing specific Key Performance Indicators (KPIs) to measure your business's success and drive growth is vital. This section will discuss some of the most important KPIs for SaaS startups and their impact on your overall strategy.
Monthly Recurring Revenue (MRR)
MRR is a measure of your predictable monthly revenue from all active subscribers. This metric is crucial for SaaS businesses as it provides insight into the stability and growth of your revenue stream. Track your MRR growth rate to identify trends and make informed decisions about your business strategy.
Annual Recurring Revenue (ARR)
Similar to MRR, ARR measures the recurring revenue your subscribers generate over a year. This metric provides a more extended view of your revenue trends and can help evaluate the success of your long-term strategies.
Customer Acquisition Cost (CAC)
CAC is the total cost of acquiring a new customer, including marketing and sales expenses. This metric is crucial for understanding the efficiency of your customer acquisition efforts and determining whether you're spending too much or too little to attract new customers.
Lifetime Value (LTV)
LTV represents the total revenue you expect to generate from a customer throughout their relationship with your business. This metric helps you understand the long-term value of your customers and informs your marketing and sales strategies. Aim for an LTV to CAC ratio of 3:1 or higher to ensure a healthy balance between acquisition costs and customer value.
Churn Rate
Churn rate measures the percentage of customers who cancel their subscriptions within a given period. A high churn rate can significantly impact your revenue growth and indicates potential issues with customer satisfaction, product-market fit, or pricing strategy. Monitor and analyze churn rates to identify trends and implement strategies to reduce customer attrition.
Average Revenue Per User (ARPU)
ARPU is the average revenue generated per user or customer within a specific time period. This metric helps you understand how much value each customer brings to your business and can inform pricing strategies and product offerings. Track ARPU over time to identify trends and uncover opportunities for growth and optimization.
Conversion Rate
Conversion rate measures the percentage of users who complete a desired action, such as signing up for a trial or subscribing to your service. This metric helps you gauge the effectiveness of your marketing campaigns, onboarding process, and overall user experience. Regularly monitor your conversion rate to identify areas for improvement and ensure users successfully move through your sales funnel.
Gross Transaction Value (GTV)
Gross Transaction Value (GTV) is a key performance indicator representing the total monetary value of all transactions made through a platform or marketplace within a specific period without accounting for any deductions such as refunds, discounts, or fees. GTV provides an overview of the platform's overall activity and can be used to measure growth trends and the effectiveness of marketing and sales strategies.
Average Order Value (AOV)
AOV is a key e-commerce metric that measures the average amount of money a customer spends per transaction on a website or online store. It is calculated by dividing the total revenue generated by the number of orders placed within a specific time period. AOV helps businesses understand their customers' purchasing behavior, enabling them to optimize marketing strategies, pricing, and product offerings to maximize revenue and profitability. Increasing AOV can be achieved through upselling, cross-selling, and offering discounts on higher-value items or bundles.
Startup Runway
Startup runway is a financial metric that indicates how long a startup can continue operating with its current cash balance before running out of funds or needing additional financing. It is typically expressed in months and calculated by dividing the startup's available cash by its monthly burn rate (the rate it spends its cash reserves). A longer runway gives a startup more time to achieve profitability or secure additional funding. In comparison, a shorter runway signals an urgent need to increase revenue, reduce expenses, or raise more capital.
By closely monitoring these KPIs, SaaS startups can identify trends, uncover potential issues, and make data-driven decisions to optimize their strategies, ultimately leading to sustainable growth and success.
Breakeven Analysis
Breakeven analysis is a vital financial tool for tech startups, offering a clear understanding of when the business will start generating profits by pinpointing the exact moment revenues match up with costs.
This analysis is instrumental in guiding strategic decisions, particularly in areas of pricing, investments, and growth initiatives.
By identifying the minimum sales needed to cover expenses, breakeven analysis not only aids in setting realistic revenue goals but also plays a crucial role in assessing the feasibility of the business model and pricing structure.
It also informs targeted marketing and sales strategies, ensuring efficient resource allocation, and is key in communicating the financial trajectory of the startup to investors and other stakeholders.
The breakeven point in business is a critical financial metric that represents the moment when a company's total revenues exactly equal its total expenses. At this point, the company is not making a profit, but it is also not incurring a loss. Calculating the breakeven point is essential for any business, as it helps in understanding the minimum performance required to avoid losing money. This calculation is particularly important for financial planning, setting sales targets, pricing strategies, and understanding the impact of cost changes on profitability.
Read more
To calculate the breakeven point, startups need to consider fixed costs (like salaries, rent, and software licenses), which remain unchanged regardless of sales volume, and variable costs (such as customer support and transaction fees), which vary with the number of customers.
Additionally, understanding the average revenue per user (ARPU) is essential. The formula for calculating the breakeven point is the total fixed costs divided by the difference between ARPU and the variable cost per user. This calculation reveals the number of customers needed to turn a profit.
Improving the breakeven point is possible through several strategies. These include refining the pricing model to enhance ARPU in line with the value offered and market standards, reducing variable costs by streamlining operations like customer support, and minimizing fixed costs through cost-effective solutions like flexible office spaces or software alternatives.
Regularly reviewing and updating the breakeven analysis is crucial, as it keeps the startup informed about its financial standing and aids in making informed decisions to quicken the path to profitability and sustainable growth.
Scenario Analysis and Sensitivity Testing
Scenario analysis and sensitivity testing are crucial techniques for assessing the impact of different variables and assumptions on your tech startup's financial model. These methods can help you understand the potential risks and opportunities associated with various business decisions or external factors.
Scenario Analysis
Scenario analysis is a comprehensive approach that enables tech startups to examine their financial models under various hypothetical circumstances thoroughly.
By creating multiple versions of the financial model based on different assumptions, such as optimistic, pessimistic, and baseline scenarios, startups can gain a deeper understanding of their financial performance in diverse situations.
This method not only helps evaluate the potential financial outcomes resulting from changing market conditions and emerging industry trends but also allows startups to assess the implications of strategic decisions, such as expanding into new markets, developing new products, or adjusting pricing structures.
The scenario analysis process involves identifying key variables, such as market size, growth rates, customer churn, and competitor actions, and then creating plausible scenarios based on these variables. For each scenario, the financial model's inputs are adjusted accordingly to reflect the changes in these variables.
This enables startups to gauge the potential impacts on their financial projections, such as revenue, profitability, and cash flow.
By comparing the results of the different scenarios, tech startups can identify potential risks and opportunities, develop strategies to capitalize on favorable outcomes and create contingency plans to address potential challenges.
Furthermore, scenario analysis can reveal vulnerabilities in the business model and highlight areas that may require additional focus or resources.
In summary, scenario analysis is an invaluable tool for tech startups, as it allows them to understand better the complex interplay of variables affecting their financial performance, make more informed decisions, and build a solid foundation for sustainable growth and success in an ever-changing business landscape.

Sensitivity Testing
Sensitivity testing is a vital technique that allows tech startups to evaluate the impact of changes in individual variables on their financial model, providing a more nuanced understanding of the factors driving their business performance.
This method, also known as "what-if" analysis, involves adjusting specific inputs, such as pricing, customer acquisition costs, growth rates, or product development timelines, and observing the resulting effects on the financial projections, including revenue, expenses, and profitability.
The process of sensitivity testing begins with identifying key variables that have a significant influence on the startup's financial performance.
Once these variables are selected, a range of plausible values is defined for each variable, reflecting potential changes that could occur due to market fluctuations, competitive pressures, or strategic decisions. The financial model is then adjusted for each of these values, and the resulting impacts on the financial projections are analyzed to determine the degree of sensitivity.
Sensitivity testing offers numerous benefits for tech startups. By identifying the key drivers of financial performance, startups can prioritize areas for risk management, allocate resources more effectively, and fine-tune their business strategies to maximize value creation.
This method also helps startups uncover hidden risks or opportunities that may not be apparent when looking at aggregated financial data. For instance, it can reveal the business's vulnerability to changes in input costs or the potential for significant gains through pricing optimization.
In conclusion, incorporating sensitivity testing into the financial modeling process equips tech startups with the knowledge and insights necessary to navigate the uncertainties and challenges of their industry.
By understanding the impact of individual variables on financial outcomes, startups can make data-driven decisions that enhance their resilience and set them on the path to long-term success.
| Aspect | Sensitivity Analysis | Scenario Analysis |
|---|---|---|
| Focus | Examines how changes in one or a few key variables impact an outcome. | Considers multiple variables and their combined impact under different scenarios. |
| Complexity | Generally simpler; focuses on varying one variable while keeping others constant. | More complex; involves changing multiple variables simultaneously. |
| Purpose | Used to determine the sensitivity of outcomes to changes in specific variables. | Used to evaluate the effects of different business scenarios or strategies. |
| Outcome | Provides specific insights on the relationship between variables and outcomes. | Offers a broader view of potential future scenarios and their implications. |
| Application | Often used in financial modeling to assess risk and uncertainty in forecasts. | Used in strategic planning to prepare for various possible future events. |
Benchmarking and Industry Comparisons
Benchmarking and industry comparisons are valuable tools for evaluating your tech startup's financial performance and identifying areas for improvement or growth.
By comparing your startup's financial metrics with industry peers or established players, you can gain valuable insights and set realistic targets for your business.
Identifying Relevant Benchmarks
Select appropriate benchmarks based on company size, growth stage, industry, and geographical location.
Consider using industry reports, research studies, or databases to gather information on relevant financial metrics, such as revenue growth rates, gross margins, or customer acquisition costs.
Comparing Your Startup's Performance
Analyze your tech startup's financial performance compared to the selected benchmarks. Identify areas where your startup outperforms or lags behind industry peers, and consider the reasons behind these differences.
This can help you uncover potential strengths, weaknesses, opportunities, or threats that may impact your startup's future success.
Setting Realistic Targets
Use benchmarking and industry comparisons to set realistic financial targets for your tech startup. Ensure that your goals are ambitious yet achievable, considering market conditions, competitive landscape, and internal capabilities.
Regularly review and update your targets as your startup evolves and new information becomes available.
By incorporating benchmarking and industry comparisons into your financial modeling process, you can create a more informed and realistic financial model that supports your startup's growth and success.

Using Assumptions and Historcial Data
Creating a robust and credible financial model for a tech startup hinges on integrating well-considered assumptions and leveraging historical data effectively. The foundation of a reliable model lies in projections rooted in past performance, coupled with realistic and research-backed expectations.
Start by crafting a set of realistic assumptions, drawing upon industry trends, market dynamics, and the unique traits of your startup. These assumptions should not only be realistic but also flexible enough to adapt as new information emerges or as the market landscape evolves.
Simultaneously, historical financial data is invaluable, providing a tangible basis for your projections. Analyze past trends in revenue, margins, and expenses to understand your startup's financial trajectory. However, it's important to remember that past trends might not always predict future outcomes, especially in a rapidly evolving tech industry.
Regular validation of your financial model against actual results is also essential. This continuous refinement process, aligning projections with real-world data, enhances the model's accuracy and relevance over time.
Such an approach ensures your financial model remains a reliable tool for strategic planning and decision-making, giving both founders and investors confidence in the startup's financial direction and potential.
Regular Review and Iteration
Keeping the financial model current is key to ensuring informed and effective financial planning and decision-making.
It's essential to actively monitor the startup's financial performance, regularly comparing actual results with the projections in the financial model. Identifying discrepancies, understanding their causes, and incorporating these insights back into the model are critical steps in maintaining its relevance and accuracy.
This process allows for adjustments based on market changes, internal dynamics, or shifts in assumptions.
Adaptability is also crucial in responding to the ever-changing conditions of the market, competition, and regulatory environment. Staying attuned to these external factors and modifying the financial model accordingly ensures that it accurately reflects the startup's current state.
Furthermore, adopting a continuous improvement approach, including seeking stakeholder feedback and regularly updating modeling techniques and data sources, enhances the model's value.
This ongoing process of reviewing, updating, and refining the financial model enables a tech startup to navigate challenges effectively and capitalize on emerging opportunities, thereby supporting its growth and success.

Common Pitfalls and How to Avoid Them
Financial modeling is an essential tool for tech startups, but it is important to be aware of common pitfalls and challenges that can compromise the accuracy and usefulness of your projections.
This section will discuss the most common mistakes made during the financial modeling process and offer practical advice on how to avoid them.
By understanding and addressing these potential issues, you can create a more robust and reliable financial model that supports your startup's strategic planning, decision-making, and fundraising efforts.
Overly Optimistic Projections
Creating a financial model for tech startups often leads to overly optimistic projections, a common misstep that may set unrealistic expectations, hinder decision-making, and challenge the process of securing investor funding. Maintaining a balance between ambition and realism is crucial.
Grounding projections in concrete data—historical performance, industry benchmarks, and realistic assumptions—ensures they reflect the startup's true potential. Incorporating scenario analysis enhances this by fostering a comprehensive view through various potential outcomes, including optimistic, pessimistic, and baseline scenarios.
This approach not only aids in understanding diverse risks and opportunities but also supports informed decision-making. Additionally, external feedback from advisors, mentors, or investors is invaluable. Their objective viewpoints can identify and rectify overly optimistic elements, refining the model to make it more credible and reliable.
Ultimately, the blend of optimism with realism, enriched by thorough analysis and external insights, culminates in a financial model that supports sound decision-making and bolsters investor confidence.

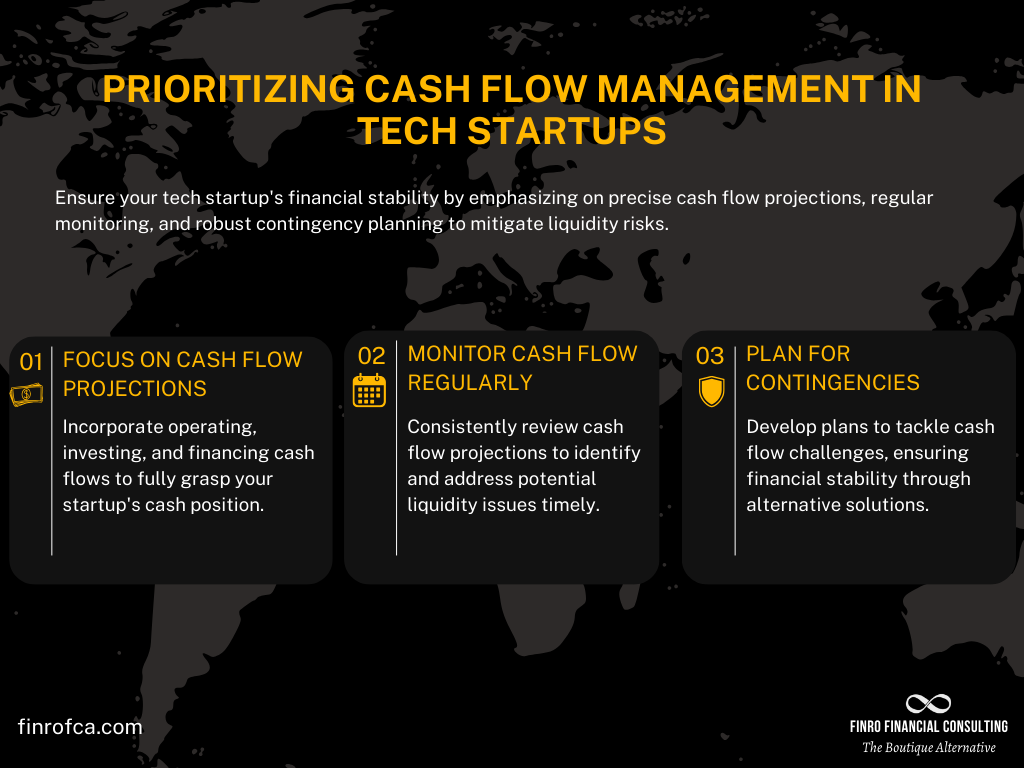
Neglecting Cash Flow Management
Creating a comprehensive financial model for tech startups involves avoiding common pitfalls like overly optimistic projections and neglecting cash flow management.
It's crucial to balance ambitious goals with realistic projections, informed by scenario analysis and external feedback. Simultaneously, managing cash flow is paramount. This includes detailed cash flow projections and regular monitoring to adapt to changing conditions.
Planning for contingencies is also vital to ensure financial stability. These practices collectively ensure a more accurate, reliable financial model, crucial for decision-making and investor confidence.
Overlooking Key Assumptions and Variables
Inaccuracies in financial models for tech startups often stem from overlooking key assumptions and variables. Thorough research to understand all factors impacting the startup's financials is essential, including industry trends, competitive dynamics, and unique company attributes.
Utilizing sensitivity testing, as previously discussed, allows for assessing the impact of specific variables, aiding in identifying major financial drivers. It's also crucial to regularly update these assumptions based on new information and changing circumstances.
This approach ensures the financial model remains accurate and reflective of the startup's situation, aiding in effective strategic planning and fundraising.

Insufficient Attention to Detail and Validation
Ensuring the accuracy and reliability of a tech startup's financial model demands meticulous attention to detail and thorough validation. It's essential to rigorously check all inputs and calculations for accuracy, cross-referencing them with credible data sources.
Testing the model's integrity by introducing changes and comparing projected outcomes with actual results helps to uncover any discrepancies. Additionally, external validation from advisors or investors provides an objective perspective, highlighting potential oversights.
This comprehensive approach not only fortifies the model's credibility but also bolsters confidence among stakeholders in the startup's strategic decisions.
Benefits of Choosing Finro As Your Startup Financial Modeling Consultant
In the digital age, where technology startups evolve at a breakneck pace, having a robust financial model is akin to possessing a detailed map in the complex journey of business growth and investment acquisition.
This crucial tool goes beyond mere projections; it encapsulates your startup's potential trajectory, providing clarity and direction for both internal strategic planning and external investment discussions.
Why Finro Stands Apart in Financial Modeling for Tech Startups:
Precision and Customization: Finro specializes in the intricate dance of financial modeling specifically tailored to the tech industry's vibrancy. Our approach meticulously crafts models that mirror your unique business dynamics, ensuring a comprehensive representation of your startup's financial future.
Deep Tech Industry Insight: Our team is not just about numbers; we're about understanding the heartbeat of technology trends, startup ecosystems, and the specific challenges and opportunities that define them. This depth of insight allows us to construct financial models that are not only accurate but also deeply reflective of the tech landscape's current and future state.
Investor-Focused Strategies: Knowing what investors seek and how they evaluate potential is critical. Finro bridges this gap by integrating a keen understanding of investor expectations into our financial models. This alignment ensures your startup is positioned compellingly in funding rounds and M&A discussions, highlighting scalability, revenue potential, and market leadership.
A Dual-Purpose Tool: With Finro, your financial model becomes a dual-purpose asset. Internally, it guides your strategic decisions, from resource allocation to risk management and scenario planning. Externally, it serves as a compelling narrative of your startup's vision, growth potential, and profitability path to potential investors and partners.
Avoiding the Pitfalls of Generalist Modeling: The complexities of the tech sector demand more than a generic financial modeling approach. Finro's specialized focus prevents common oversights and inaccuracies that can arise from a one-size-fits-all methodology, ensuring a model that's both detailed and aligned with the tech industry's nuances.
Case Study - Pangea.io: Our work with fintech startup Pangea.io exemplifies our commitment to precision and strategic impact. Despite the startup's early stage and limited financial data, we developed a model that not only facilitated internal strategy formulation but also played a pivotal role in attracting venture capital interest. This case study underscores our ability to translate visionary ideas into tangible financial narratives.
Choosing Finro - A Strategic Decision for Tech Startups:
Selecting Finro Financial Consulting as your startup financial modeling consultant means opting for a team that brings more than just analytical expertise to the table.
It means choosing a partner vested in your success, one that combines industry-specific knowledge, investor insights, and a bespoke modeling approach to illuminate your startup's path to growth and investment success.
In the constantly shifting sands of the tech industry, where innovation and adaptation are key, partnering with Finro ensures that your financial model is not just a document, but a strategic tool that drives decision-making, attracts investment, and secures your startup's future.
Let Finro be your guide in translating your technological innovations into a compelling financial story, paving the way for strategic growth and investment success.
Conclusion
A well-crafted financial model is an essential tool for tech startups to make informed strategic decisions and attract investors.
By following best practices and leveraging your financial model effectively, you can create a solid foundation for your startup's growth and success.
A robust financial model not only helps you make informed strategic decisions but also instills confidence in potential investors, increasing the likelihood of securing much-needed funding.
It is crucial to approach the financial modeling process with diligence, accuracy, and an understanding of your startup's unique needs and objectives.
If you need help building a comprehensive and reliable financial model for your startup, contact Finro. We specialize in providing startup valuation, financial modeling, and due diligence services for tech startups between the pre-seed and Series B stages.
Our experienced team can help you navigate the complexities of financial modeling and develop a model that meets your specific needs.

Key Takeaways
Strategic Decision-Making: Enables simulation of scenarios to guide growth strategies and operational decisions for startup scalability.
Investor Communication: Essential for demonstrating startup's financial health and potential, crucial in fundraising and investor discussions.
Future Projections: Includes detailed forecasts of income, expenses, cash flow, aiding in visualizing the company’s financial future.
Operational Management: Helps in resource allocation, identifying cost structures, and tracking Key Performance Indicators (KPIs) for efficient operation.
Scenario Analysis: Assesses financial resilience under various market conditions, identifying risks and opportunities for proactive strategy adjustment.
Answers to The Most Asked Questions
-
A spreadsheet forecasting a startup's financial performance to guide decisions and attract investments.
-
Combine revenue forecasts, cost analysis, cash flow, and scenario analysis for informed decision-making.
-
Start with revenue models, analyze market size and costs, then project revenue and expenses.
-
Includes income statement, cash flow, and balance sheet, showing operations and financial projections.
-
Vital for strategic planning, attracting investment, and understanding financial health.
-
Founders for planning, investors for viability assessment, and stakeholders for financial transparency.
-
Identify segments, pricing, estimate costs, and use bottom-up forecasting for accurate projections.