The Q1 2025 AI Valuation Multiples dataset analyzes 417 companies across 15 categories, highlighting how revenue multiples vary by niche, funding stage, and company type (public, private, or M&A). LLM Vendors and Search Engine startups command the highest multiples, despite relatively few players, while Infrastructure stands out for combining scale with strong valuations.
Early-stage rounds show inflated multiples driven by potential, while later stages emphasize efficiency and scale. Capital deployment, funding ratios, and investor sentiment vary widely, with categories like AI Robotics and Agents gaining momentum. The dataset provides structured benchmarks, charts, and metrics to support data-backed fundraising, investment, or valuation work.
AI Startup Valuations in 2025: Benchmarks Across 400+ Companies
Author
Lior Ronen
Founder of Finro Financial Consulting. Personally leads every valuation, modeling, and M&A advisory engagement.
View Lior's profile →
Analysis by
Finro Financial Consulting
Startup valuation, financial modeling, and M&A advisory for AI, fintech, and SaaS companies. Serving funded tech startups from pre-seed through pre-IPO.
About Finro →AI funding hasn’t slowed down, but how investors are pricing AI startups has definitely shifted.
Valuation multiples vary wildly depending on the niche, the round, and whether the company is private, public, or acquired.
Some categories are trading at 70x revenue, while others struggle to justify double digits.
We’ve compiled and analyzed data from over 400 AI companies across 15 categories to see where the market is putting its weight.
This isn’t just another market snapshot; it’s a structured look at how investors think about AI today based on real funding, revenue, and multiples.
If you’re raising, investing, or just trying to benchmark your startup’s numbers, the breakdown below will help you get a clearer picture of what’s considered high, average, or undervalued across the AI landscape.

What This Analysis Covers
The dataset includes 417 AI companies: 290 private, 32 public, and 95 involved in M&A deals.
We categorized each company by its core niche and latest funding round, then calculated average revenue multiples, total funding raised, and capital efficiency (valuation relative to total funding).
Companies range from early-stage startups to late-stage giants.
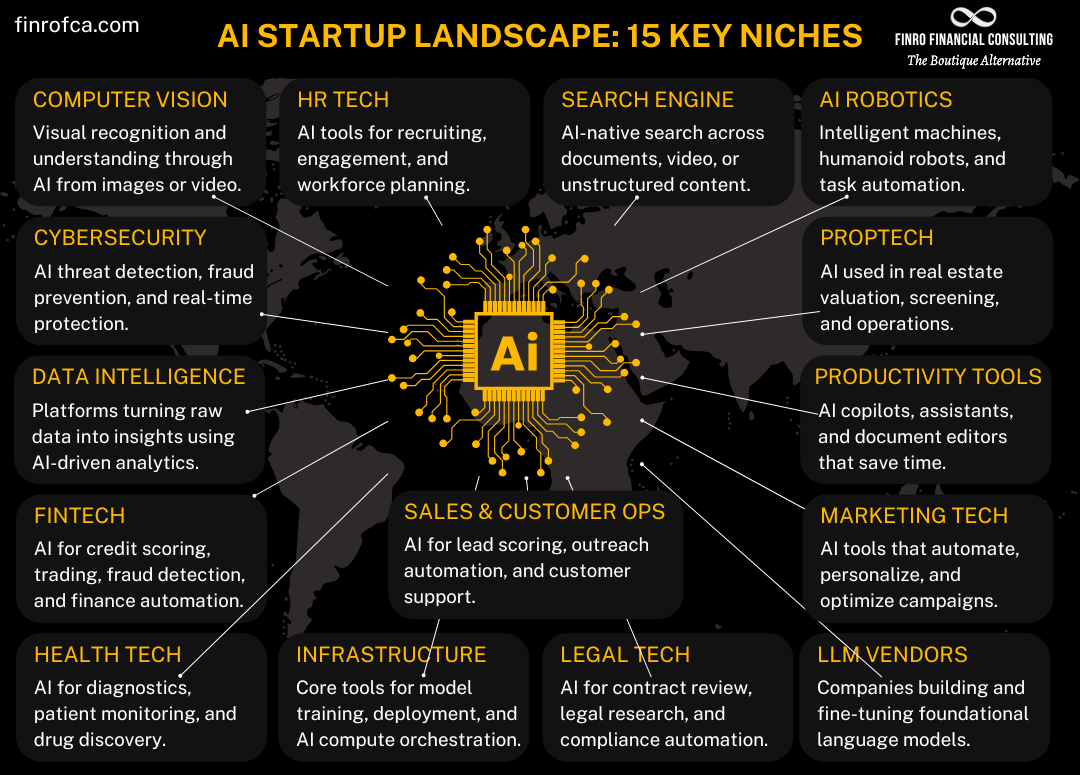
Categories include everything from LLM vendors and Infrastructure to Legal Tech, Robotics, and Search. Funding stages span Seed to Series J.
All data points are based on publicly available information, disclosed round terms, and verified estimates.
The goal: to provide a clean, structured view of where valuations sit right now, and how they vary depending on where a company plays and how far along they are.
Let’s start with the breakdown by category.
Valuation Multiples by AI Category
AI valuations are anything but uniform. Some categories, like LLM Vendors and Search, are priced at a premium, while others like Legal Tech and PropTech sit much lower on the scale.
The differences aren’t random, they reflect how investors currently perceive risk, revenue potential, and competitive moats across segments.
LLM Vendors top the chart with an average revenue multiple of 44.1x, heavily influenced by high private valuations.
Search Engines follow closely at 30.9x, driven by strong monetization models and low marginal costs. Infrastructure, Data Intelligence, and AI Robotics also stand out as high-multiple categories, each combining technical defensibility with broad applicability.
On the other end, Legal Tech and PropTech trade at average multiples below 16x, suggesting slower adoption or more niche markets.
Marketing Tech and Sales Tools fall somewhere in between, widely used, but not always seen as core infrastructure.
The takeaway? Where a company sits, not just how much it makes, plays a big role in how it’s valued.
Next, let’s break it down by funding round to see how these multiples evolve as companies grow.
Finro Research Hub
Explore the full AI Valuation Research Hub →

Valuation Multiples by Funding Round
Valuation multiples shift noticeably as companies progress through funding stages.
Early-stage rounds like Seed and Series A come with inflated multiples, often because revenue is low or nonexistent, so investors are pricing potential more than performance.
For example, Seed-stage companies in this dataset show an average multiple of 20.8x, despite generating just $2M in revenue on average.
Series A and B see the highest multiples across the board, 39.0x and 31.7x respectively, as companies start to show traction but are still raising on the strength of momentum, team, and market positioning.
By Series C and D, revenue and funding both increase significantly, but multiples compress. At that point, investors are looking more closely at efficiency, scale, and margins.
Later rounds (Series E and beyond) are a different story altogether. Valuations jump into the multi-billion range, but revenue multiples drop to around 21.2x, as these rounds are often driven by late-stage or pre-IPO investors looking for exposure to category leaders.
Multiples alone don’t tell the full story, though. To see how volume and valuation interact, let’s look at the market through a different lens: company count vs. average multiple.

Bubble Chart Analysis: What the Market Is Prioritizing
The bubble chart below maps each AI category by number of companies, average revenue multiple, and relative size. It gives a clear visual of how valuations relate to both scale and investor concentration.
What stands out immediately is the positioning of LLM Vendors in the upper-left corner.
Despite having only 15 companies in the dataset, they hold the highest average revenue multiple at 44.1x.
This suggests a highly selective market, where a small number of companies are commanding premium valuations, a sign that investors see this space as winner-takes-most.
Search Engine companies show a similar pattern. With only 8 companies represented and a 30.9x average multiple, it’s another area where perceived defensibility, monetization potential, and category positioning drive high valuations despite limited breadth.
On the other end, Infrastructure represents the largest category by volume with 90 companies, and also holds a strong average multiple of 23.2x.
This combination of high scale and solid valuation points to sustained investor interest in tools and platforms that serve as the backbone of AI development and deployment.
Marketing Tech, while one of the more crowded categories with 59 companies, sits at a more moderate 16.8xmultiple. That suggests broad adoption, but less pricing power, likely a result of commoditization and a crowded vendor landscape.
AI Robotics and Health Tech offer a middle ground. Both have fewer companies but maintain strong multiples (21.9x and 21.4x, respectively), reflecting investor belief in their long-term potential despite technical complexity or capital requirements.
Overall, the data reflects a clear pattern: categories with fewer companies and high perceived strategic value are receiving stronger multiples, while broader categories with more participants often sit closer to the median. The market is placing a premium on scarcity, technical edge, and long-term defensibility, not just growth.
Next, we’ll look at what these trends mean for investors trying to identify where the market is still assigning upside, and for founders positioning their next raise.

What This Means for Founders and Investors
Valuation multiples vary widely across the AI landscape, and knowing where your company fits has real implications. For founders, it’s a reminder to ground your expectations in market reality.
A 30x multiple isn’t a given. In some categories, it’s on the high end. In others, it may be below average. Understanding where your niche sits helps set the tone for fundraising conversations and can shape how you position traction, team, and roadmap.
For investors, the takeaway is just as clear: multiples alone don’t tell the full story. High valuations with low revenue may still be justified, but only if capital efficiency is strong, product adoption is clear, and a competitive advantage holds. That’s why we’ve also included EV-to-funding ratios and round-level summaries throughout the dataset.
Looking ahead, a few themes are starting to stand out.
AI Agents are gaining real traction, but differentiation will matter more than ever. Robotics is turning from deep-tech hype into something commercially fundable.
And in Infrastructure, we’re already seeing signs of consolidation as cloud-native players, model builders, and orchestration platforms collide.
This is where the spreadsheet comes in, it helps put structure behind that story.
Let’s wrap with what’s inside the file and how to get it.
AI Valuation Multiples Database
Benchmark AI valuations with real comps.
Public, private, and M&A coverage. Niche tagging. EV/Revenue + EV/EBITDA (when available).
Built for investor conversations, not screenshots.
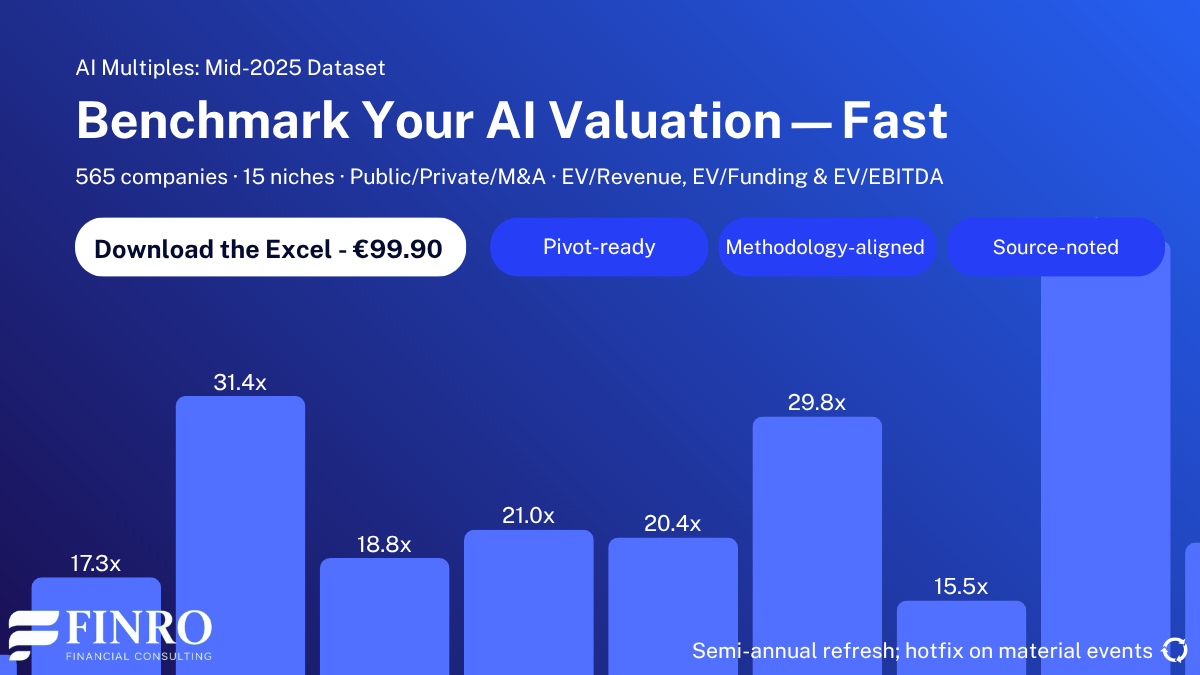
565+ companies
15 niches
Cycle-over-cycle analysis
Source trail
View AI Multiples Database →
Typical use: round pricing, IC memos, M&A comps, narrative support.
Inside the AI Valuation Multiples Dataset
This analysis is built on a structured database of 417 AI companies, including private startups, public players, and recent M&A deals.
Each company is categorized by niche and funding round, with standardized data on revenue, valuation, and total funding raised.
From that, we calculated key metrics like average revenue multiples, EV-to-funding ratios, and capital efficiency across every segment.
The result is a clear, benchmarkable view of how the AI market is priced — whether you’re comparing categories, evaluating stage-by-stage trends, or looking at what drives premium multiples.
The full dataset is available as a downloadable Excel file and includes:
400+ companies across 15 AI categories
Public, private, and M&A deal breakdowns
Revenue multiples by niche and funding round
Capital efficiency ratios (EV / total funding)
Summary tables and visual charts (bar, bubble, and round-based views)
Instant Excel download — no subscription required
Whether you’re raising, investing, or analyzing, this tool gives you the structure and clarity to back it up with data.