From Seed to Scale: Analyzing Revenue Growth Patterns in Tech Startups
By Lior Ronen | Founder, Finro Financial Consulting
At Finro, we've had the opportunity to work with over 200 tech companies across various niches from 2017 to 2024. Through this experience, we’ve analyzed the financial projections of these startups, uncovering valuable insights that can help other founders benchmark their revenue projections.
In this article, we’re diving into the data to provide a clear picture of how revenue projections vary across different tech niches, funding stages, revenue statuses, and the years these projections were created. Whether you’re in the early stages of your startup or further along, understanding these trends can offer a quick rule of thumb to see if your revenue projections are on the right track.
Let’s break down the results and see what they reveal about the startup landscape.
From 2017 to 2024, an analysis of financial projections for over 200 tech startups revealed key insights into growth patterns across various niches, funding stages, and revenue statuses. High-growth niches like SaaS, AI, and Social Media demonstrated sustained expansion, while sectors such as Edtech and AgTech showed significant variability.
Series A and B stages exhibited the highest growth rates, emphasizing their critical role in early-stage expansion, whereas later stages like Series C and D indicated more stabilized growth. Pre-Revenue startups experienced explosive initial growth, which tapered off post-revenue, highlighting the need for strategic planning and operational optimization as startups mature. These findings provide valuable benchmarks and growth metrics to guide startup founders in their financial planning and decision-making processes.
Revenue Projections Growth Analysis By Niches
As I mentioned earlier, we analyzed the financial projections of more than 200 tech startups across various niches to extract valuable insights. These findings can help founders benchmark their figures and serve as a quick reference for projection exercises.
In this section, we'll start dissecting the data by reviewing the growth rates per niche. We categorized the startups into different niches such as HealthTech, Ecommerce, Fintech, SaaS, and others. Each niche represents a specific area of the tech industry, allowing us to compare and contrast growth patterns within and across these sectors.
For each niche, we examined the year-over-year growth rates from Year 2 to Year 5. This timeframe provides a comprehensive view of how these startups evolve over time. The growth rates are represented as percentages, showing the average increase or decrease in revenue compared to the previous year.
We'll present key insights and industry averages that can guide your startup's financial planning and expectations. By understanding these trends, you'll be better equipped to benchmark your own projections and identify potential areas for growth or improvement.
High Growth Niches
SaaS: Startups in the SaaS niche exhibit exceptionally high growth in Year 2 (418%). While the growth stabilizes in later years, it remains impressive with 166% in Year 3, 103% in Year 4, and 62% in Year 5. This indicates a strong initial uptake followed by steady growth, making SaaS a promising sector.
Social Media: Companies in this niche maintain strong growth throughout the years, particularly in Year 2 (829%) and Year 3 (316%). Although the growth rate decreases in Year 4 (204%) and Year 5 (108%), it remains substantial, showcasing the sector's potential for sustained expansion.
AI: AI startups demonstrate significant growth, especially in Year 2 (2056%) and Year 3 (393%). The growth remains strong but more moderate in Year 4 (158%) and Year 5 (77%), indicating a high potential for rapid early-stage growth.
Steady Performers
HealthTech: HealthTech companies show consistent performance with high growth in Year 2 (264%) and Year 4 (212%). Although there is a dip in Year 3 (96%) and Year 5 (54%), the sector still reflects solid and sustained growth.
Fintech: Fintech startups show robust growth across all years, peaking in Year 2 (514%) and maintaining high levels in Year 3 (185%), Year 4 (102%), and Year 5 (76%). This steady performance highlights the resilience and potential of the Fintech sector.
Moderate and Declining Growth
Ecommerce: This niche displays variable growth with a peak in Year 3 (139%) but lower growth in other years (91% in Year 2, 45% in Year 4, and 29% in Year 5). The initial momentum tapers off over time, suggesting a need for sustained innovation to maintain growth.
Edtech: Edtech shows strong initial growth (1198% in Year 2) but experiences significant drops in subsequent years (119% in Year 3, 69% in Year 4, and 47% in Year 5). This decline underscores the challenges of sustaining high growth rates in this niche.
Inconsistent Performers
AgTech: AgTech startups show negative growth in some years (-1% in Year 2 and Year 5) but significant positive growth in others (370% in Year 3 and 148% in Year 4). This inconsistency could indicate a volatile market or varying business models within the niche.
PropTech: PropTech exhibits moderate growth with a peak in Year 2 (214%) but shows variability in later years (59% in Year 3, 30% in Year 4, and 108% in Year 5). Founders in this niche should be prepared for fluctuating growth patterns.
High Initial Growth with Stabilization
App Development: Startups in app development display high initial growth (1082% in Year 2) but level off significantly in subsequent years (35% in Year 3, 14% in Year 4, and 10% in Year 5). This suggests fast adoption followed by market saturation, highlighting the importance of long-term planning.
Total Average Insights
The total average growth across all niches shows a sharp decline from Year 2 (442%) to Year 3 (194%), then continues to decrease steadily in Year 4 (102%) and Year 5 (64%). This overall trend indicates that while many startups experience rapid initial growth, sustaining high growth rates becomes challenging over time.
Key Takeaways for Startup Founders
Focus on High Growth Niches: Niches like SaaS, AI, and Social Media show strong and sustained growth, making them attractive for new startups.
Prepare for Stabilization: Many niches show high initial growth followed by stabilization, emphasizing the importance of planning for long-term sustainability.
Beware of Volatility: Some niches, such as AgTech and Edtech, exhibit significant variability in growth, suggesting a need for careful market analysis and risk management.
Benchmarking: Use these growth metrics to benchmark your own startup's performance against industry averages to gauge if you’re on the right track.
By understanding these trends and benchmarks, startup founders can make more informed decisions, set realistic goals, and navigate the complexities of scaling their businesses.
| Niche | Year 2 | Year 3 | Year 4 | Year 5 |
|---|---|---|---|---|
| HealthTech | 264% | 96% | 212% | 54% |
| Ecommerce | 91% | 139% | 45% | 29% |
| Consumer Electronics | 153% | 117% | 75% | 111% |
| Fintech | 514% | 185% | 102% | 76% |
| SaaS | 418% | 166% | 103% | 62% |
| Cybersecurity | 135% | 63% | 18% | 18% |
| Marketing Tech | 540% | 282% | 156% | 93% |
| Communications Hardware | 122% | 450% | 39% | 28% |
| Autotech | 186% | 31% | 39% | 32% |
| Edtech | 1198% | 119% | 69% | 47% |
| Insurtech | 23% | 23% | 23% | 23% |
| CleanTech | 387% | 368% | 108% | 59% |
| Social Media | 829% | 316% | 204% | 108% |
| AI | 2056% | 393% | 158% | 77% |
| AgTech | -1% | 370% | 148% | -1% |
| IaaS | 200% | 119% | 482% | 54% |
| App Development | 1082% | 35% | 14% | 10% |
| PropTech | 214% | 59% | 30% | 108% |
| Gaming | 2063% | 152% | 55% | 53% |
| CRM | 479% | 185% | 119% | 103% |
| AR | 174% | 64% | 52% | 54% |
| Total Average | 442% | 194% | 102% | 64% |
Revenue Projections Growth Analysis by Funding Stages
Analyzing the year-over-year growth data across various funding stages offers valuable insights into how startups evolve as they progress through different rounds of funding.
This section breaks down the growth rates for startups at different funding stages, helping founders benchmark their own projections and set realistic expectations.
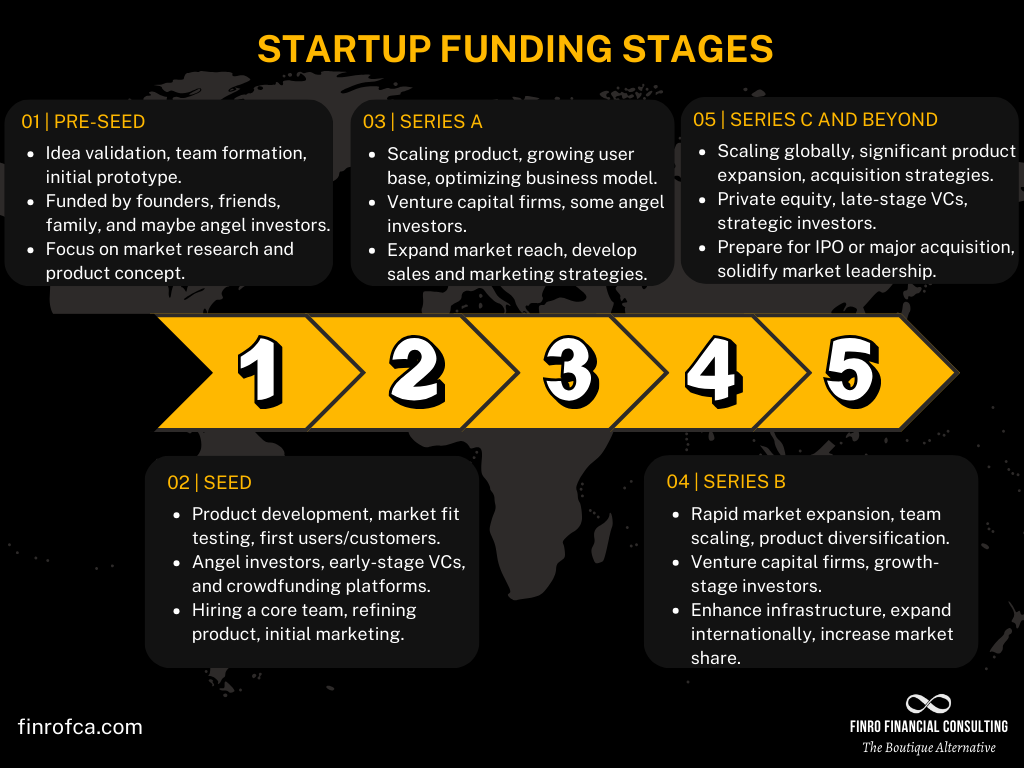
We categorized the startups based on their funding stages: Pre-Seed, Seed, Series A, Series B, Series C, Series D, and M&A. Each stage represents a different phase in a startup's growth journey, with distinct characteristics and growth patterns. The M&A category refers to startups that build their revenue projections to be acquired or attract investment.
For each funding stage, we examined the year-over-year growth rates from Year 2 to Year 5. This timeframe provides a comprehensive view of how these startups evolve over time. The growth rates are represented as percentages, showing the average increase or decrease in revenue compared to the previous year.
In this section, you'll see a detailed breakdown of growth rates by funding stages, along with key insights and industry averages that can guide your startup's financial planning and expectations.
High Growth Funding Stages
Series A: Companies in the Series A stage demonstrate the highest growth rates, particularly in Year 2 (1554%) and Year 3 (266%). Although growth declines in Years 4 (114%) and 5 (71%), Series A remains a critical period for rapid expansion.
Series B: Startups in the Series B stage also show strong growth, especially in Year 2 (786%). Growth rates decrease to 91% in Year 3, 83% in Year 4, and 54% in Year 5, indicating a transition to more sustainable growth.
Steady Performers
Pre-Seed: Startups at the Pre-Seed stage exhibit significant growth in Year 2 (484%) and Year 3 (175%), followed by relatively stable growth in Years 4 (184%) and 5 (74%). This stage is crucial for establishing early momentum.
Seed: Seed stage companies maintain robust growth in the early years with 694% in Year 2 and 245% in Year 3. Growth stabilizes in Years 4 (158%) and 5 (81%), marking a period of solid expansion.
Moderate and Declining Growth
M&A: Startups in the M&A category, which build revenue projections to attract acquisition or investment, show consistent growth with 152% in Year 2 and 91% in Year 3. Growth declines in Years 4 (46%) and 5 (43%), reflecting the transition towards maturity and market positioning.
Series C: At this stage, companies experience more stabilized growth with lower rates compared to earlier stages. Year 2 growth is 70%, decreasing to 27% in Year 3, 26% in Year 4, and 25% in Year 5.
Series D: Series D startups show modest growth with 40% in Year 2, decreasing gradually to 34% in Year 3, 30% in Year 4, and 28% in Year 5. This stage often involves mature companies facing market saturation.
Key Takeaways for Startup Founders
Leverage Early-Stage Growth: The Pre-Seed, Seed, and Series A stages are critical periods for rapid growth. Founders should capitalize on this momentum to establish a strong market presence.
Prepare for Stabilization: As startups progress to Series B and beyond, growth rates tend to stabilize. Founders should plan for sustainable growth strategies to maintain upward momentum.
Adapt to Changing Dynamics: In later funding stages, growth can become more challenging due to market saturation and increased competition. Founders need to innovate continually and adapt their business models to sustain growth.
By understanding these growth patterns across different funding stages, startup founders can better navigate their funding journey and optimize their strategies for each stage of development.
| Stage | Year 2 | Year 3 | Year 4 | Year 5 |
|---|---|---|---|---|
| Pre-Seed | 484% | 175% | 184% | 74% |
| Seed | 694% | 245% | 158% | 81% |
| Series A | 1554% | 266% | 114% | 71% |
| Series B | 786% | 91% | 83% | 54% |
| Series C | 70% | 27% | 26% | 25% |
| Series D | 40% | 34% | 30% | 28% |
| M&A | 152% | 91% | 46% | 43% |
Revenue Projections Growth Analysis by Revenue Status
Analyzing the year-over-year growth data by revenue status provides valuable insights into how startups perform before and after generating revenue. This section breaks down the growth rates for pre-revenue and post-revenue startups, helping founders benchmark their projections and set realistic expectations.
We categorized the startups into two groups: Pre-Revenue and Post-Revenue. Pre-Revenue startups are those that have not yet started generating revenue, while Post-Revenue startups have already begun earning revenue.
For each revenue status, we examined the year-over-year growth rates from Year 2 to Year 5. This timeframe provides a comprehensive view of how these startups evolve over time. The growth rates are represented as percentages, showing the average increase or decrease in revenue compared to the previous year.
In this section, you'll see a detailed breakdown of growth rates by revenue status, along with key insights and industry averages that can guide your startup's financial planning and expectations.
High Growth in Pre-Revenue Startups
Startups in the Pre-Revenue stage exhibit remarkable growth in Year 2 with an average growth rate of 1390%. This explosive growth rate tapers off to 223% in Year 3 and further to 167% in Year 4. By Year 5, the growth rate stabilizes at 78%. This stage reflects the initial surge in development and market entry efforts.
Moderate and Steady Growth in Post-Revenue Startups
Post-Revenue startups show more moderate growth compared to their Pre-Revenue counterparts. Year 2 sees a growth rate of 276%, followed by 171% in Year 3. The growth rate decreases significantly in Years 4 and 5 to 79% and 54%, respectively. This pattern indicates a shift towards sustained and more manageable growth as startups mature and establish their market presence.
Key Takeaways for Startup Founders
Leverage Initial Momentum: Pre-Revenue startups often experience explosive growth as they develop their products and enter the market. Founders should capitalize on this momentum to gain traction and visibility.
Plan for Stabilization: As startups transition to the Post-Revenue stage, growth rates tend to moderate. Founders should focus on achieving sustainable growth and optimizing operations to maintain steady progress.
Benchmarking Performance: Understanding the typical growth trajectories for Pre-Revenue and Post-Revenue startups can help founders set realistic goals and measure their performance against industry benchmarks.
By understanding these growth patterns based on revenue status, startup founders can better navigate the early stages of development and transition smoothly into sustained growth phases.
| Revenue | Year 2 | Year 3 | Year 4 | Year 5 |
|---|---|---|---|---|
| Pre-Revenue | 1390% | 223% | 167% | 78% |
| Post-Revenue | 276% | 171% | 79% | 54% |
Surprising Trends in Revenue Projections
Throughout our analysis of financial projections from over 200 tech startups, several surprising trends emerged that warrant special attention.
These unexpected patterns provide deeper insights into the dynamics of startup growth and can help founders refine their strategies.
Explosive Growth in Series A Startups
Observation: Startups in the Series A stage exhibit remarkably high growth rates, particularly in Year 2 (1554%) and Year 3 (266%).
Surprise Factor: The extent of growth at this stage is unexpected. While high growth is anticipated during Series A, the actual figures surpass typical expectations, highlighting the critical importance of this funding round for startup expansion.
Dramatic Decline in Edtech Growth
Observation: Edtech startups show strong initial growth (1198% in Year 2) but experience significant drops in subsequent years (119% in Year 3, 69% in Year 4, and 47% in Year 5).
Surprise Factor: The steep decline in growth rates is surprising given the increasing global focus on educational technology. This trend underscores the challenges within the Edtech sector, such as market saturation and the need for continuous innovation.
Variability in AgTech Performance
Observation: AgTech startups show negative growth in some years (-1% in Year 2 and Year 5) but significant positive growth in others (370% in Year 3 and 148% in Year 4).
Surprise Factor: The inconsistency in growth rates highlights the volatility and varying business models within the AgTech niche. This trend suggests that AgTech startups face unique challenges that can lead to highly fluctuating performance.
Strong Initial Growth in Pre-Revenue Startups
Observation: Pre-Revenue startups exhibit remarkable growth in Year 2 with an average growth rate of 1390%.
Surprise Factor: The sheer magnitude of early-stage growth for Pre-Revenue startups is unexpected. It reflects the significant investments and rapid development efforts in the initial phases but also points to the potential challenges in sustaining such high growth rates as these startups mature.
Stabilization in Post-Revenue Startups
Observation: Post-Revenue startups show more moderate growth compared to their Pre-Revenue counterparts, with growth rates of 276% in Year 2 and decreasing to 54% by Year 5.
Surprise Factor: The rate at which growth stabilizes for Post-Revenue startups highlights the transition from rapid expansion to more manageable and sustained growth. This trend emphasizes the importance of strategic planning and operational efficiency in the post-revenue phase.
High Initial Growth Followed by Stabilization in App Development
Observation: Startups in app development display high initial growth (1082% in Year 2) but level off significantly in subsequent years (35% in Year 3, 14% in Year 4, and 10% in Year 5).
Surprise Factor: The rapid initial adoption followed by significant stabilization suggests that the app development sector experiences quick market saturation. This trend underscores the importance of innovation and diversification for sustained success in this niche.
These surprising trends provide deeper insights into the dynamics of startup growth across different stages and niches. Understanding these unexpected patterns can help founders better anticipate challenges, leverage opportunities, and refine their strategies for long-term success.

Conclusion
Through our analysis of the financial projections of over 200 tech startups from 2017 to 2024, we've uncovered valuable insights that can help founders benchmark their revenue projections and set realistic growth expectations.
By examining growth patterns across different tech niches, funding stages, and revenue statuses, we've provided a comprehensive view of how startups evolve over time.
Key Insights:
Niche Performance: High-growth niches like SaaS, AI, and Social Media show strong and sustained growth, making them attractive sectors for new startups. Meanwhile, niches like Edtech and AgTech exhibit significant variability, requiring careful market analysis and risk management.
Funding Stage Analysis: The Seed and Growth stages are critical periods for rapid expansion, with the highest growth rates observed in Series A and Series B startups. As companies mature and move into the Late Stage, growth rates tend to stabilize, emphasizing the importance of sustainable growth strategies.
Revenue Status: Pre-Revenue startups often experience explosive early-stage growth as they develop their products and enter the market. Post-Revenue startups show more moderate and steady growth, highlighting the need for long-term planning and operational optimization.
Takeaways for Founders:
Capitalize on Early-Stage Growth: Leverage the initial momentum in the Seed and Growth stages to establish a strong market presence and gain traction.
Plan for Sustainability: As your startup matures, focus on achieving sustainable growth and optimizing operations to maintain steady progress.
Benchmark Your Performance: Use industry averages and growth metrics to set realistic goals and measure your startup’s performance against peers.
By understanding these trends and benchmarks, startup founders can make informed decisions, set achievable targets, and navigate the complexities of scaling their businesses. Whether you’re in the early stages of your startup or further along, these insights provide a valuable framework for planning and executing your growth strategy.
At Finro, we're committed to helping startups succeed by providing the tools and insights needed to thrive in a competitive landscape. Use these findings as a guide to benchmark your projections, identify growth opportunities, and steer your startup towards long-term success.