Top SaaS KPIs to Track
By Lior Ronen | Founder, Finro Financial Consulting
Business intelligence is crucial to a SaaS startup's success.
Tracking key performance indicators (KPIs) enables startups to measure progress, health, and efficiency across key areas like financials, marketing, sales, and operations.
KPIs are quantifiable, measurable goals that help startups monitor progress toward long-term strategic objectives.
Since every SaaS startup is unique, the specific KPIs used will vary.
However, there are common SaaS KPIs that most startups should track.
This article outlines the top KPIs SaaS startups should consider when assessing overall company health and progress toward goals.
While revenue growth and customer metrics like average revenue per user are important, gaining true insights requires examining multiple factors together - from user base growth to expenses to strategic initiatives.
The KPIs discussed here provide a 360-degree view of the startup's position.
These SaaS metrics are essential inputs into the financial models we build or analyze for SaaS startups. Of course, different revenue models may require tailored variations.
We welcome you to share any unique key metrics you track for your startup in the comments.
Business intelligence is essential for SaaS startups, enabling them to track progress and optimize strategies through key performance indicators (KPIs) like MRR, CAC, ROAS, and ARPU. These metrics illuminate financial health, customer engagement, and marketing effectiveness, guiding startups towards sustainable growth.
Adapting and refining KPIs to unique business needs enhances competitive edge and strategic agility. Sharing KPI insights within the SaaS community promotes innovation and collective success.
Monthly Recurring Revenue (MRR)
Monthly Recurring Revenue (MRR) is a vital metric SaaS and subscription businesses use to evaluate company health.
MRR is calculated by multiplying the average monthly revenue per paying customer by the number of subscribers that month.
Tracking MRR over time provides insights into:
Total revenue from subscriptions
Revenue fluctuations month-to-month
Trends in expansion/churn/new MRR to inform forecasts
Analyzing at least 24 months of MRR data enables identifying:
Year-over-year growth
Seasonal impacts
One-time events
For some SaaS businesses, Annual Recurring Revenue (ARR) makes more sense for analysis than monthly revenue. The calculation remains the same, just with annual instead of monthly subscription fees.
Whether a SaaS startup focuses on MRR or ARR depends on if they charge subscriptions monthly or annually. Both metrics provide value in assessing the overall revenue stream.
For further reading visit our guides about the Monthly Recurring Revenue (MRR) and Annual Recurring Revenue (ARR).

Customer Acquisition Cost (CAC)
Customer Acquisition Cost (CAC) is a vital Key Performance Indicator (KPI) for SaaS companies to track.
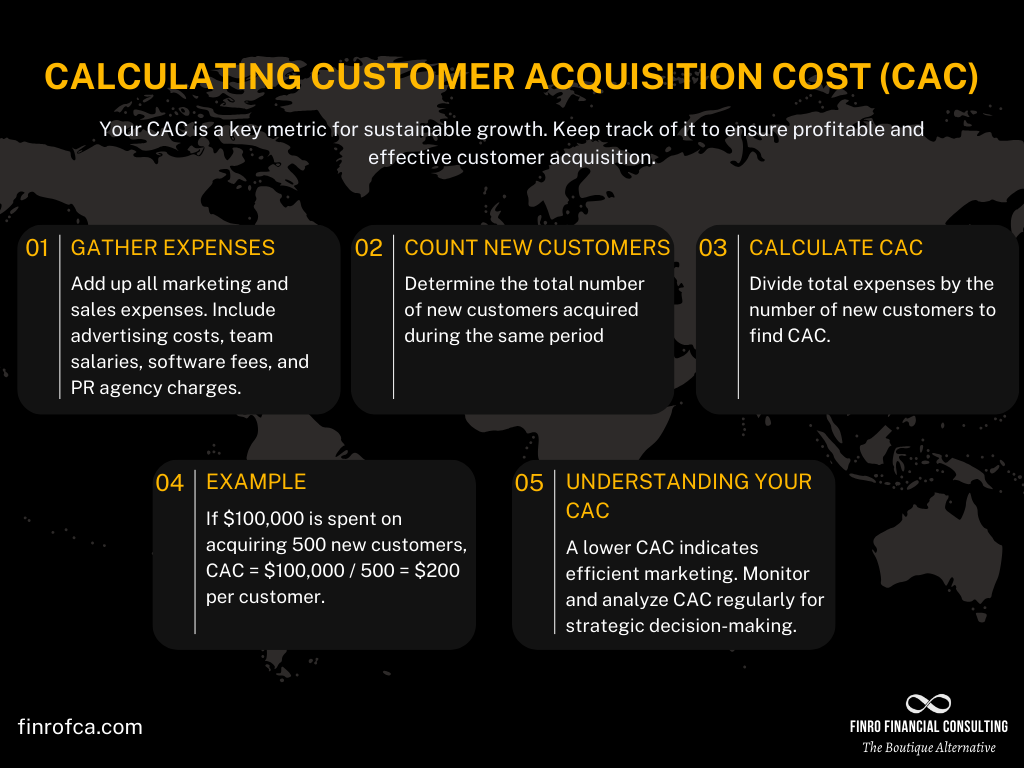
CAC represents the total sales and marketing spend required to acquire one new customer over a defined time period - typically a month or quarter.
Specifically, it is calculated by dividing total sales & marketing expenses by the number of new customers added in that period.
Monitoring CAC enables startups to:
Evaluate the effectiveness of sales & marketing activities
Identify the most profitable customer acquisition channels
Optimize spending to reduce CAC over time
Set targets for the CAC payback period
While an increasing customer base is important, keeping CAC sustainable relative to customer lifetime value is crucial. No startup wants to spend $2 in sales and marketing to acquire a customer that provides $1 in revenue!
Analyzing CAC trends and dashboarding key drivers is vital for SaaS startups to scale customer acquisition efficiently. Comparing CAC across acquisition channels and buyer personas allows startups to double down on the most profitable segments.
For a further read, visit our guide about the Customer Acquisition Cost (CAC)
Return On Ad Spend (ROAS)
Return On Ad Spend (ROAS) is a valuable marketing performance metric for eCommerce and SaaS businesses.
While related to Customer Acquisition Cost (CAC), ROAS takes a broader look at marketing spend efficiency. It measures the revenue generated per dollar of advertising spent across campaigns.
Specifically, ROAS is calculated by dividing total revenue from marketing efforts by total marketing spend over a defined period.
Monitoring ROAS enables businesses to:
Identify the highest-performing marketing channels
Optimize budget allocation across channels
Set benchmarks and optimize for improved ROAS
For example, analyzing the ROAS across channels like social media ads, SEM, affiliates, and influencers allows businesses to double down on those delivering the best returns.
Looking at ROAS trends also helps make decisions on marketing budget increases or decreases to achieve growth and profitability goals.
What is the Difference Between CAC and ROAS?
| Aspect | Customer Acquisition Cost (CAC) | Return on Advertising Spend (ROAS) |
|---|---|---|
| Definition | The cost associated with acquiring a new customer, taking into account marketing and sales expenses. | The revenue generated from advertising campaigns relative to the cost of those campaigns. |
| Formula | CAC = (Total Marketing and Sales Expenses) / (Number of New Customers Acquired) | ROAS = (Revenue from Ad Campaign) / (Cost of Ad Campaign) |
| Purpose | Used to evaluate the efficiency and effectiveness of marketing efforts in acquiring new customers. | Used to assess the effectiveness of advertising campaigns in generating revenue. |
| Focus | Broader metric that encompasses overall marketing and sales costs. | Specifically focuses on advertising expenses and the revenue generated from those expenses. |
| Interpretation | Lower CAC indicates more cost-effective customer acquisition. High CAC may suggest inefficiencies or high market competition. | Higher ROAS indicates more effective advertising spend. Low ROAS suggests that advertising may not be cost-effective. |
| Application | Useful for budgeting, financial forecasting, and evaluating the overall cost-effectiveness of marketing strategies. | Primarily used to optimize advertising campaigns and allocate advertising budget more effectively. |
| Optimization | Businesses aim to reduce CAC while maintaining or increasing the quality of customer acquisition. | The goal is to increase ROAS by either reducing advertising costs, increasing revenue, or both. |
Burn Rate
Burn rate is a vital cash flow metric for early-stage, pre-revenue startups dependent on external funding. It measures how quickly a startup is spending its capital to finance operations and growth.
Specifically, the burn rate is calculated by:
(Beginning Cash Balance - Ending Cash Balance) / Time Period in Months
Tracking burn rate enables startups to:
Monitor monthly and projected spending of investor capital
Understand when additional funding may be required
Optimize spending to extend the runway until profitability
For venture-backed startups, analyzing burn rate trends is key. It shows investors how efficiently the startup deploys capital. Rapidly increasing burn rates can set off alarms.
Setting targets for burn rate reduction demonstrates financial responsibility.
The most successful startups maintain focus on capital efficiency even while pursuing growth.
For further reading, visit out Burn Rate guide,

Average Revenue Per User (ARPU)
Average Revenue Per User (ARPU) is a vital SaaS metric for analyzing revenue trends, uncovering issues, and forecasting.
Specifically, ARPU is calculated by dividing total revenue over a period by the number of users/subscribers in that same period. Keeping the time period consistent is crucial - i.e. monthly revenue divided by average monthly subscribers.
Monitoring ARPU enables SaaS businesses to:
Gauge pricing and account tiering strategies
Set pricing optimization targets
Identify upsell/cross-sell opportunities
Inform future revenue projections
For some SaaS models, Average Revenue Per Account (ARPA) makes more sense than ARPU. The calculation remains the same.
No matter which metric is used, tracking revenue relative to customers/subscriptions provides vital intelligence for data-driven decisions to drive growth.
For a further read, visit our ARPU guide.
Average Order Value (AOV)
Average Order Value (AOV) is a vital eCommerce metric that measures the average spend per transaction on a website.
Similar to ARPU for SaaS, AOV offers product-based businesses simple insight into revenue performance. Specifically, it is calculated by dividing total revenue over a period by the number of orders placed in that period.
Monitoring AOV enables eCommerce businesses to:
Understand average customer spend habits
Optimize pricing strategies to increase basket size
Identify cross-sell and upsell opportunities
Set targets for AOV growth
While revenue and order volume are critical, AOV shines light on the money left on the table with each transaction. Tiny gains in AOV can mean huge revenue lifts. Maximizing AOV is key for eCommerce profitability at scale.
Paired with order volume and conversion rate data, AOV analysis provides actionable intelligence for boosting the top line.
| Aspect | Average Revenue Per User (ARPU) | Average Order Value (AOV) |
|---|---|---|
| Definition | The average revenue received from each user or customer over a specific period. | The average value of each order placed over a specific period. |
| Formula | ARPU = (Total Revenue) / (Total Number of Users) | AOV = (Total Revenue) / (Total Number of Orders) |
| Purpose | Used to assess the overall value generated from each user, helping in the analysis of revenue growth and user engagement. | Used to evaluate the effectiveness of marketing and pricing strategies by understanding the average spending per order. |
| Focus | Focuses on revenue generated per user, providing insight into the value each user contributes to the business. | Focuses on the transaction level, indicating how much customers are spending on average per order. |
| Interpretation | Higher ARPU indicates greater revenue generation efficiency per user. | Higher AOV suggests that customers are spending more per transaction, which could indicate successful upselling or pricing strategies. |
| Application | Useful for measuring revenue growth, user engagement strategies, and the overall health of a business. | Primarily used to optimize pricing, promotions, and product placement to increase customer spending. |
| Optimization | Businesses aim to increase ARPU through up-selling, cross-selling, and improving user engagement. | Strategies like improving product recommendations, bundling products, and offering promotions aim to increase AOV. |
Startup Runway
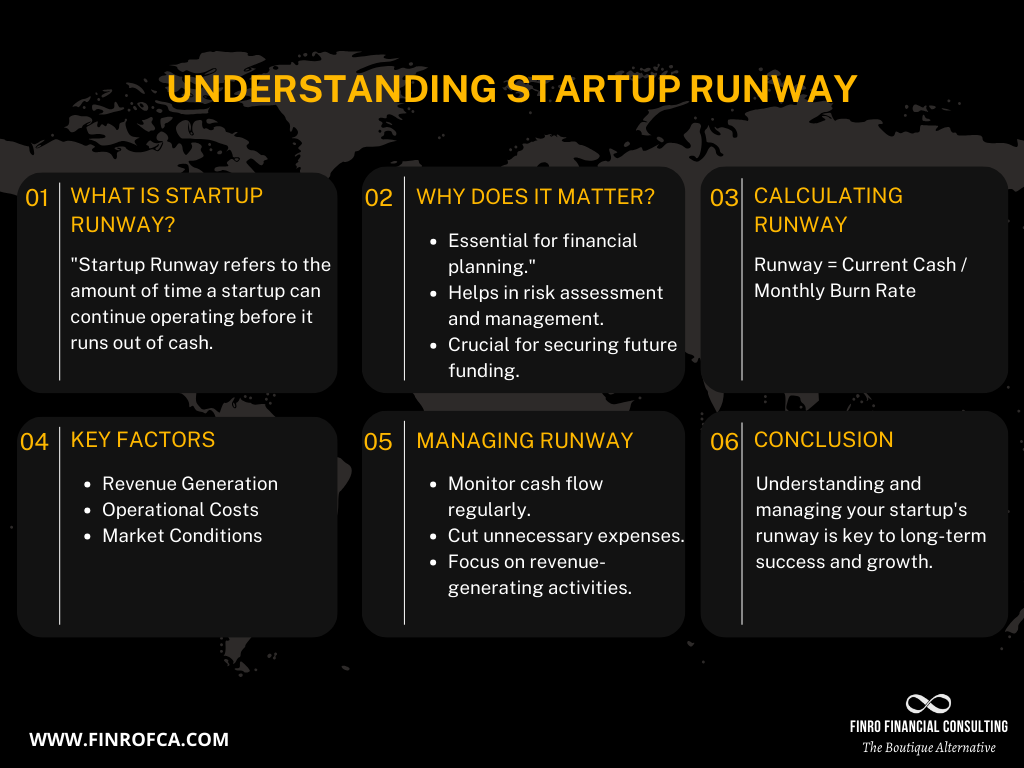
Runway is a vital metric that measures a startup’s longevity based on current financial health. Specifically, it indicates the number of months a startup can continue operating before needing to secure additional funding, given the current burn rate.
The runway calculation is:
Total Cash Balance / Average Monthly Burn Rate
Tracking runway enables startups to:
Assess how long current funding will last
Model funding requirements for future milestones
Make decisions about when to raise next round
Optimize spending to extend runway
For early-stage startups, monitoring changes in runway is critical. As milestones like product launch or scaling approach, evaluating needed capital is essential.
Extending runway as long as sustainably possible allows founders to increase value, retain more equity, and approach fundraising from a position of strength.
For further reading, visit our guide about the Startup Runway.
Profit Margins
Profit margins are key indicators of a business's financial health, allowing for benchmarking and trend analysis independent of company size or scale. Key margins SaaS startups should monitor include:
Gross Margin - Gross Profit / Revenue Measures profitability from core business operations.
Operating Margin - Operating Profit / Revenue Accounts for sales, R&D, admin costs required to run the business.
EBITDA Margin - EBITDA / Revenue Useful for capital intensive startups where D&A skews operating profit.
Tracking margins over time enables startups to:
Assess overall profitability and efficiency
Set targets for margin improvement
Model impact of growth investments on profitability
Benchmark against industry averages
While growth is important early-on, monitoring margins ensures business model sustainability. The healthiest SaaS startups balance targeted expansion with strong fundamentals.
For further read, visit our guides about EBITDA and Gross Margin.

OpEx to Revenues
The Operating Expense to Revenue ratio (OpEx/Revenue) is an important metric for early-stage SaaS startups to regularly monitor.
This ratio measures the level of investment in product development and go-to-market relative to the revenue generated. Early on, most high-growth startups purposefully operate at a high ratio, spending aggressively on R&D and sales to capture market share.
As startups mature and scale, the OpEx/Revenue benchmark ratio declines over time. Monitoring this metric enables founders to:
Assess progress from early to growth stage
Benchmark against typical trajectories by stage
Model the relationship between operating leverage and revenue
Make investments to balance growth with optimal ratio targets
Startups should analyze this ratio alongside gross and operating margins to strategically pace operating expenses growth relative to rising revenues. Though spending aggressively early on is wise, the healthiest startups methodically drive towards profitability.
For a further read, visit our guide about decoding the tech startup costs.

Conversion Rate
Conversion rate is a crucial metric for SaaS businesses that measures the percentage of visitors that become paying customers.
It is calculated by dividing the number of converting users by the total number exposed to an offering. For example, if 100 people view a signup page and 5 sign up, the conversion rate is 5%.
Monitoring conversion rates across customer onboarding funnels enables SaaS startups to:
Identify signup friction points
Test pricing page messaging
Optimize marketing campaign targeting
Set goals for improved conversion
Since pricing is relatively fixed for most SaaS models, customer volume is the primary revenue growth driver. That’s why high-growth startups obsess over funnel optimization to convert visitors into loyal, paying users as efficiently as possible.
Paired with customer acquisition cost data, conversion rate analysis provides actionable insights on the most profitable customer segments to acquire.
For a further read, visit our guide about Conversion Rates.

Churn Rate
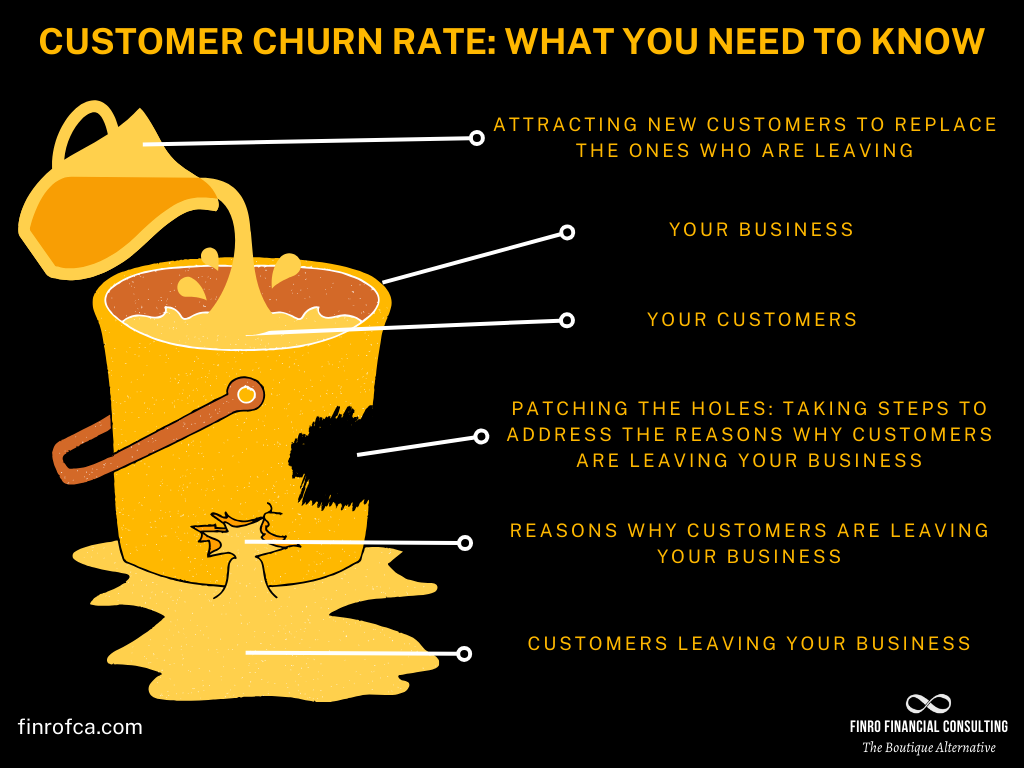
Customer churn rate is a critical metric that measures the percentage of customers that discontinue subscribing to a SaaS platform over a given period. It is calculated by dividing churned customers by the starting customer count.
Monitoring churn enables startups to:
Assess overall customer satisfaction
Identify issues driving churn
Model impact of churn on revenue projections
Set targets for reducing churn
Customer retention rate, which measures subscription renewal rates, is the flip side of the same coin. As retention goes up, churn goes down.
Maximizing retention by keeping customers highly satisfied sustains growth by making churn negligible. Industry benchmarks provide goals for startups to target as they scale.
While both churn and retention rates offer insights, analyzing just one metric provides the necessary perspective into customer volumes. Tracking changes in churn or retention over time is most insightful.
For a further read, visit our detailed guide about the customer churn rate.
Customer Lifetime Value (LTV)
Customer Lifetime Value (LTV) represents the total revenue a business can expect from a customer across their entire relationship. It is calculated by forecasting future repeat sales over time.
Monitoring LTV helps SaaS startups:
Gauge customer profitability
Model impacts of churn on revenue
Identify upsell & cross-sell opportunities
Optimize price points for profitability
The LTV to CAC ratio is extremely insightful. It compares the revenue a customer will likely generate to the sales expense of acquiring them. Industry benchmarks show sustainable businesses have a LTV:CAC of 3:1 or higher.
Maximizing LTV and minimizing CAC ensures acquiring customers remain profitable as startups scale. Adding features that increase user longevity or order values directly lifts LTV.
Paired together, LTV and CAC provide actionable metrics for startups to efficiently acquire and monetize customers.
For a further read, visit our guide about the customer lifetime value (LTV).
Monthly Active Users (MAU)
Monthly Active Users (MAU) is a vital engagement and growth metric that measures the number of unique users who actively engage with a SaaS platform over a 30-day period.
Tracking MAU enables startups to monitor adoption and usage over time. Comparing MAU to total registered users also provides insight into retention and churn.
As a supplemental metric to revenue data, MAU helps SaaS startups:
Gauge product-market fit
Benchmark adoption rates against targets
Identify issues driving churn
Optimize user onboarding workflows
Model impacts of enhanced engagement
While revenue numbers don’t lie, MAU helps tell the growth story. Spikes or dips can indicate issues or opportunities to boost sticky adoption. High-growth startups analyze usage cohorts to target power users.
Monitoring MAU trends provides well-rounded intelligence on product traction and market penetration over time.
For further read, visit our detailed MAU guide.

Conclusion
In conclusion, the vitality of business intelligence in guiding SaaS startups towards success cannot be overstated.
By meticulously tracking and analyzing key performance indicators (KPIs), startups gain invaluable insights into their operational efficiency, financial health, and strategic direction.
The comprehensive list of KPIs outlined in this article, including Monthly Recurring Revenue (MRR), Customer Acquisition Cost (CAC), Return On Ad Spend (ROAS), and Average Revenue Per User (ARPU), among others, provides a foundational framework for SaaS startups to monitor and assess their progress.
These metrics, each offering unique insights into different facets of the business, collectively enable startups to make informed decisions, optimize operations, and drive sustainable growth.
Understanding and leveraging these KPIs effectively allows startups to navigate the competitive landscape with greater agility and precision, ultimately leading to enhanced performance and long-term success.
As the SaaS industry continues to evolve, the ability to adapt and refine these KPIs to fit unique business models will remain a cornerstone of strategic business intelligence.
We encourage startups to share their experiences and insights on additional KPIs, fostering a collaborative environment for mutual growth and learning within the SaaS community.
Key Takeaways
Business intelligence, through KPI tracking, is critical for SaaS startup success, guiding strategy and measuring efficiency.
Key SaaS KPIs include MRR, CAC, ROAS, and ARPU, essential for evaluating financial health and customer engagement.
Effectively leveraging KPIs allows startups to optimize strategies for sustainable growth and improved investor relations.
Customizing KPIs to unique business needs enhances strategic agility and competitive edge in the SaaS industry.
Sharing KPI insights promotes collective success and innovation within the SaaS community.
Answers to The Most Asked Questions
-
Important KPIs for SaaS companies include Monthly Recurring Revenue (MRR), Customer Acquisition Cost (CAC), Return On Ad Spend (ROAS), and Average Revenue Per User (ARPU).
-
Leading indicators for SaaS businesses can be considered metrics like conversion rate, churn rate, and Monthly Active Users (MAU) that predict future performance.
-
While the text doesn't specify a single most important KPI, it suggests that MRR is vital for evaluating company health.
-
A SaaS metric is a quantifiable measure used to track and assess the performance and health of a Software as a Service (SaaS) company, such as MRR, CAC, or ARPU.
-
Customer Acquisition Cost (CAC) is the total sales and marketing expense required to acquire one new customer over a defined time period.
-
Customer Lifetime Value (LTV) represents the total revenue a business can expect from a customer throughout their entire relationship.
-
Average Revenue Per User (ARPU) is a metric calculated by dividing total revenue over a period by the number of users/subscribers in that same period.