What Goes Into a Financial Model?
By Lior Ronen | Founder, Finro Financial Consulting
Creating a solid financial model is one of the most critical tasks for any entrepreneur looking to raise funds or secure a loan. It's a common scenario: you’ve nailed your pitch, impressed potential investors, and then they ask for your financial model.
This is the moment when many entrepreneurs start to feel overwhelmed. Instead of panicking and downloading countless templates, it's crucial to understand how to translate your business idea into a clear and concise financial model.
A financial model isn’t just a set of numbers; it’s a representation of your business plan in financial terms. It helps potential investors see the potential of your business, understand how you plan to achieve your goals and make informed decisions.
Building a financial model can be a bit daunting, but focusing on the key elements of your business can make the process much more manageable and effective.
In this article, we’ll break down the primary components that go into a financial model. We’ll look at what’s essential, what you can leave out, and how to present your financial data in a way that is both accurate and compelling.
Whether you’re a first-time entrepreneur or looking to refine your financial planning skills, this guide will help you create a financial model that stands out.
A financial model is essential for entrepreneurs to plan strategically, evaluate business viability, secure funding, and make informed decisions. It includes revenue and expense projections, advanced financial statements, and key performance indicators (KPIs) to gauge business performance.
Benchmarks provide context by comparing against industry standards and competitors. Tools like Excel and Google Sheets offer different advantages for building and managing these models, depending on specific business needs. Ultimately, a well-constructed financial model communicates a business's potential and guides ongoing financial management and decision-making.
Understanding the Purpose of a Financial Model
A financial model is more than just a spreadsheet with numbers; it's a vital tool that translates your business idea into a structured plan. The primary goal of creating a financial model is to provide a clear picture of your business’s financial future.
This includes projecting revenues, expenses, and cash flows, which helps you understand how your business will perform over time.
There are several key objectives when building a financial model:
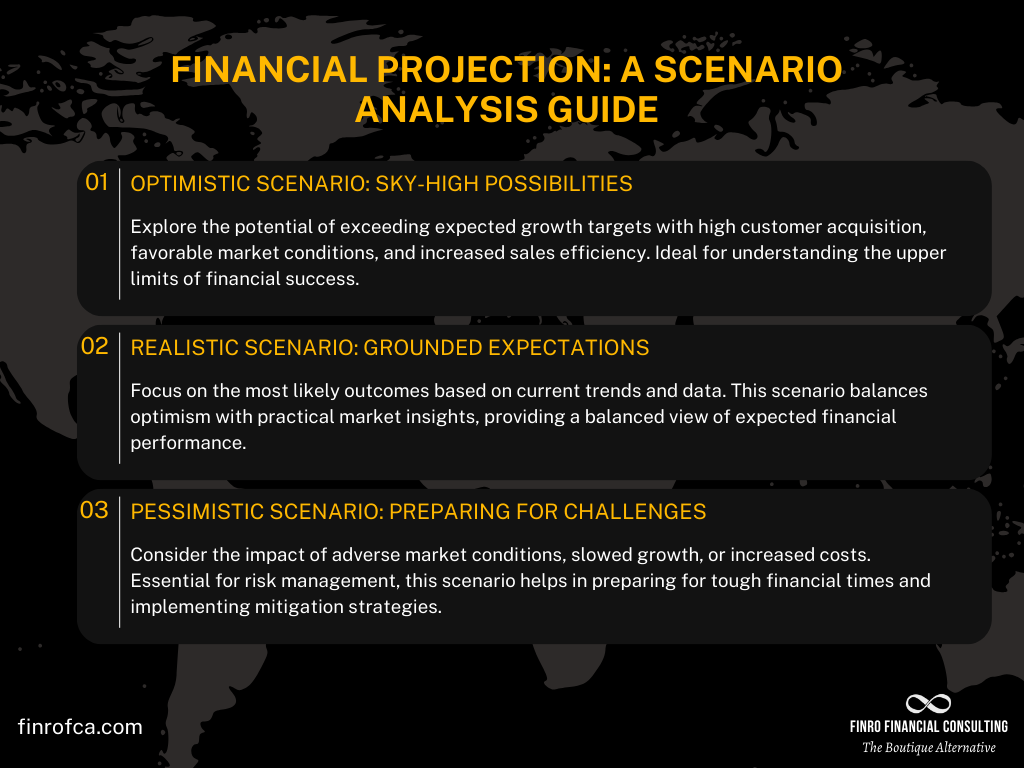
Planning and Forecasting: A financial model allows you to predict future financial performance based on various assumptions about revenue growth, expenses, and other key factors. This helps you plan strategically and set realistic goals.
Evaluating Business Viability: By laying out all financial aspects of your business, you can determine if your business idea is viable and identify potential financial challenges before they become critical issues.
Supporting Fundraising Efforts: Investors and lenders rely heavily on financial models to assess the potential return on their investment. A well-prepared financial model can demonstrate your business's potential for growth and profitability, making it easier to secure funding.
Decision Making: A financial model provides a framework for making informed business decisions. Whether you're considering a new product line, market expansion, or cost-cutting measures, the model can help you evaluate the financial impact of these decisions.
Performance Monitoring: Once your business is up and running, you can use your financial model to track performance against your projections. This ongoing comparison helps you stay on course and make adjustments as needed.
In essence, a financial model serves as a bridge between your business idea and its practical implementation. It helps you map out the financial aspects of your plan, making it easier to communicate your vision to stakeholders and to guide your business towards success.
Get your expert support now!
Key Components of a Financial Model
Building on the understanding of the purpose of a financial model, it's time to dive into its key components.
These elements form the backbone of your financial model, providing a detailed picture of your business’s financial health. Let's start with revenue projections, move on to expense projections, and finally, we'll discuss the profit and loss statement.
Revenue Projections
Revenue projections are the cornerstone of any financial model. They form the top line of your income statement and are critical for determining your business's potential growth and profitability.
Importance of Accurate and Realistic Revenue Forecasts
Accurate and realistic revenue forecasts are essential for several reasons. Firstly, they provide a benchmark against which all other financial metrics are measured.
Overestimating revenues can lead to poor financial planning, while underestimating can limit your business’s potential. Investors and stakeholders rely heavily on these projections to assess your business’s viability and potential return on investment.
Example Breakdown of Revenue for Different Business Models
Revenue models can vary significantly based on the type of business. For instance, a SaaS (Software as a Service) company might project revenue based on subscription fees, while an e-commerce business would focus on product sales.
SaaS: Revenue is typically broken down into monthly or annual subscription fees, with additional projections for upselling and renewals.
E-commerce: Revenue is based on the number of units sold, average order value, and repeat purchase rate.
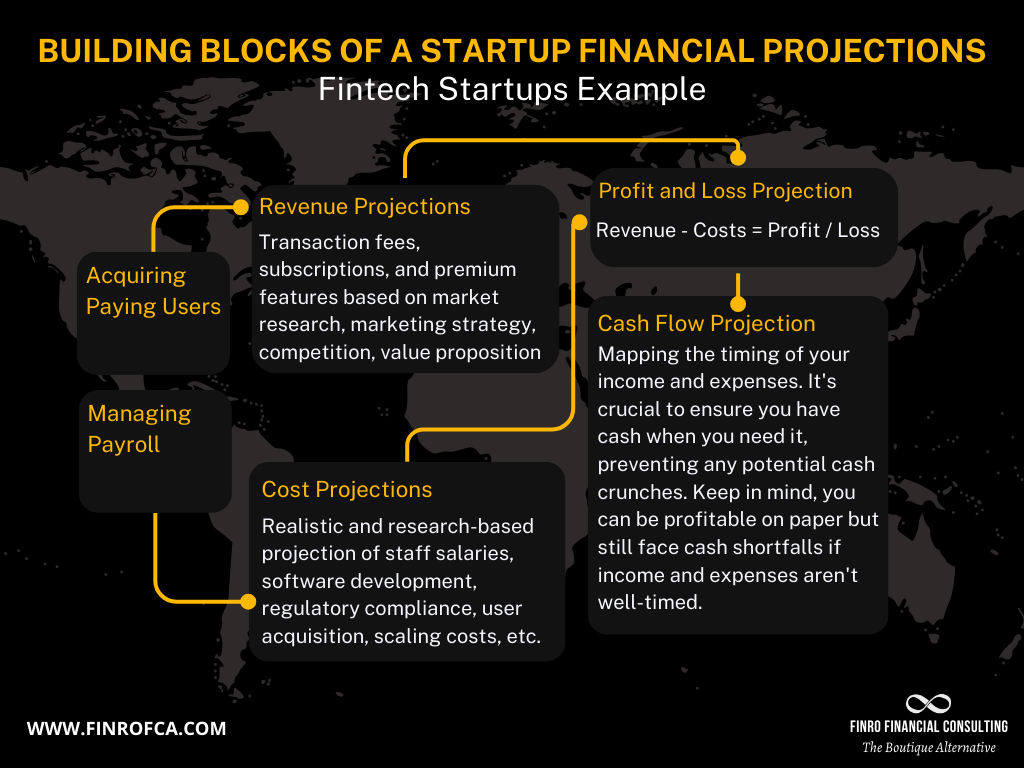
Fintech: Revenue can come from transaction fees, interest on loans, subscription fees for premium services, and partnerships with financial institutions.
Detailed Explanation of User Base and Pricing Strategies
In a SaaS business, revenue projections start with the user base. This involves estimating the number of new users acquired through different channels (e.g., social media ads, organic search), factoring in conversion rates, and churn rates.
Pricing strategies also play a crucial role. You need to define your pricing tiers, potential upgrades, and any discounts or promotions.
For an e-commerce business, it’s about understanding your customer acquisition cost (CAC) and how this translates to sales. Pricing strategies might include dynamic pricing, bundling products, or offering seasonal discounts.

Expense Projections
After projecting your revenues, the next step is to forecast your expenses. Understanding your costs is essential for maintaining profitability and ensuring sustainable growth.
Categorizing and Forecasting Operating Expenses
Operating expenses are the day-to-day costs required to run your business. These can be categorized into several key areas, such as:
Fixed Costs: These are expenses that remain constant regardless of your business’s activity level, such as rent, salaries, and insurance.
Variable Costs: These expenses fluctuate with your business’s activity level, like shipping costs, raw materials, and sales commissions.
Importance of Including Variable and Fixed Costs
It’s crucial to differentiate between fixed and variable costs to understand how changes in your business activity levels impact your overall expenses. This helps in planning for scalability and managing operational risks.
Considering Unexpected Costs and Contingencies
No financial model is complete without accounting for unexpected costs. This could include unforeseen market changes, regulatory impacts, or unexpected repairs and maintenance. Setting aside a contingency fund can help cushion these unexpected expenses and ensure your business remains financially resilient.

Profit and Loss Statement (Income Statement)
The profit and loss statement, also known as the income statement, brings together your revenue and expense projections to show your business's profitability over a specific period.
Explanation of How to Structure an Income Statement
An income statement typically starts with revenue, subtracts the cost of goods sold (COGS) to calculate gross profit, and then subtracts operating expenses to determine net profit.
Key Elements to Include
Revenue: The total income generated from sales or services.
COGS (Cost of Goods Sold): Direct costs attributable to the production of the goods sold by the company.
Gross Profit: Revenue minus COGS, showing the profit made before deducting operating expenses.
Operating Expenses: Costs required to run the business, including fixed and variable costs.
Net Profit: The final profit after all expenses have been deducted, indicating the business’s overall financial performance.
Understanding and accurately forecasting these components will give you a solid foundation for your financial model, helping you to present a clear and compelling financial picture to investors and stakeholders.
Advanced Financial Statements
Having laid the groundwork with revenue and expense projections, as well as understanding the profit and loss statement, it's essential to delve into advanced financial statements. These statements provide a more comprehensive view of your financial health and are crucial for detailed financial planning and analysis. We will explore balance sheet projections and the cash flow statement, explaining their importance and how to approach them effectively.
Balance Sheet Projections
While revenue and expense projections give a snapshot of your profitability, the balance sheet provides a broader picture of your company's financial position at a given point in time.
When and Why a Balance Sheet Projection Might Be Necessary
A balance sheet projection is crucial for understanding your company’s financial stability and structure. It is particularly important when you need to show potential investors or lenders the assets you own, the liabilities you owe, and the equity you have built up. It helps in assessing your company’s liquidity, solvency, and overall financial health.
Key Components: Assets, Liabilities, and Equity
Assets: These are resources owned by the company that have economic value. Assets can be current (cash, inventory, receivables) or non-current (property, equipment).
Liabilities: These are obligations that the company needs to pay off. Liabilities can be current (accounts payable, short-term loans) or long-term (long-term debt, bonds).
Equity: This represents the owners' residual interest in the company after liabilities are deducted from assets. It includes common stock, retained earnings, and additional paid-in capital.
Simplified Approach for Startups with Minimal Capital Expenditures
For startups, especially those with minimal capital expenditures (CapEx), a simplified balance sheet can suffice. Focus on key items such as cash on hand, any significant receivables, payables, and equity contributions from founders or investors.
Keeping the balance sheet straightforward helps maintain clarity and avoid unnecessary complexity.

Cash Flow Statement
The cash flow statement complements the income statement and balance sheet by showing how cash moves in and out of the business, ensuring that you have enough liquidity to sustain operations.
Importance of Cash Flow Management
Cash flow management is vital because it ensures that your business can meet its obligations, such as paying salaries, suppliers, and rent.
Positive cash flow is an indicator of financial health and operational efficiency. It also allows for reinvestment in the business, facilitating growth and expansion.
Differences Between Income Statement and Cash Flow Statement
While the income statement shows profitability over a period, the cash flow statement provides a detailed account of cash inflows and outflows.
The key difference is that the cash flow statement focuses on cash transactions, while the income statement includes non-cash items like depreciation and accruals.
Critical Elements: Operating Activities, Investing Activities, and Financing Activities
Operating Activities: These include cash flows from primary business operations, such as cash received from sales and cash paid for operating expenses.
Investing Activities: These involve cash flows related to the acquisition and disposal of long-term assets, such as purchasing equipment or selling property.
Financing Activities: These include cash flows from transactions with the company’s owners and creditors, such as issuing stock, taking on loans, and repaying debt.
Understanding and accurately forecasting these components will give you a solid foundation for your financial model, helping you to present a clear and compelling financial picture to investors and stakeholders.
By integrating these advanced financial statements into your model, you provide a more comprehensive and nuanced view of your business’s financial situation. This not only enhances your ability to manage your finances effectively but also strengthens your case when seeking investments or loans.

Key Performance Indicators (KPIs)
With a solid understanding of revenue projections, expense forecasting, and advanced financial statements, the next crucial element to focus on is Key Performance Indicators (KPIs).
KPIs provide insights into your business’s performance and are essential for monitoring progress and making informed decisions.
KPIs are specific, measurable metrics that reflect the critical success factors of a business. They help quantify the performance and efficiency of various aspects of your operations, providing a clear picture of how well your business is achieving its objectives.
The importance of KPIs in a financial model cannot be overstated. They allow you to:
Track Progress: Regularly monitoring KPIs helps you understand whether you are on track to meet your business goals.
Make Informed Decisions: KPIs provide the data needed to make strategic decisions, such as where to allocate resources or which areas need improvement.
Demonstrate Value: To investors and stakeholders, KPIs offer concrete evidence of your business’s potential and performance.

Examples of Relevant KPIs for Different Business Models
Different business models will focus on different KPIs based on their unique operational and strategic goals. Here are a few examples:
SaaS (Software as a Service):
ARR (Annual Recurring Revenue): The value of recurring revenue from subscriptions normalized for one calendar year.
MRR (Monthly Recurring Revenue): The value of recurring revenue from subscriptions normalized for one month.
Churn Rate: The percentage of subscribers who cancel their subscriptions over a given period.
E-commerce:
Customer Acquisition Cost (CAC): The cost associated with acquiring a new customer. CAC = Total Cost of Sales and Marketing / Number of New Customers Acquired.
Average Order Value (AOV): The average amount spent by a customer in a single transaction.
Customer Lifetime Value (LTV): The total revenue expected from a customer over the duration of their relationship with the business. LTV = Average Revenue Per User (ARPU) × 1/Churn Rate
Fintech:
Transaction Volume (GTV): The total number of transactions processed over a specific period.
Net Interest Margin (NIM): The difference between interest income generated and interest paid out, relative to the amount of interest-earning assets. Net Interest Margin = (Interest Income − Interest Expense) / Average Interest-Earning Assets
Active Users (MAU): The number of unique users engaging with the fintech platform within a certain period.
Using KPIs effectively involves:
Regular Monitoring: Continuously track your KPIs to stay updated on your business’s performance.
Benchmarking: Compare your KPIs against industry standards or competitors to understand your relative performance.
Actionable Insights: Use the insights gained from KPIs to make strategic adjustments. For instance, if your CAC is high, you might need to re-evaluate your marketing strategies.
Reporting: Regularly report KPIs to stakeholders to keep them informed about the business’s performance and strategic direction.
By integrating KPIs into your financial model, you gain a powerful tool for driving business success.
KPIs not only help in tracking performance but also in making data-driven decisions that align with your long-term goals.

Including Benchmarks
After establishing the foundation of your financial model with revenue projections, expense forecasts, advanced financial statements, and KPIs, the next step is to include benchmarks.
Benchmarks play a crucial role in providing context to your financial data and helping you gauge your business’s performance against industry standards.
The Role of Benchmarks in a Financial Model
Benchmarks serve as reference points that help you evaluate how well your business is performing compared to others in your industry. They provide a standard for measuring various aspects of your business, such as profitability, efficiency, and growth. Including benchmarks in your financial model can help you:
Identify Strengths and Weaknesses: By comparing your performance to industry standards, you can pinpoint areas where you excel and areas that need improvement.
Set Realistic Goals: Benchmarks provide a realistic target for your business to aim for, helping you set achievable goals.
Validate Your Projections: Investors and stakeholders often look for benchmarks to validate the assumptions and projections in your financial model.
How to Choose Relevant Benchmarks and Compare Them to Your Business
Selecting the right benchmarks is crucial for meaningful comparisons. Here’s how to choose relevant benchmarks and compare them to your business:
Identify Key Metrics: Determine which metrics are most important for your business. These could include revenue growth, profit margins, customer acquisition costs, and more.
Research Industry Standards: Look for industry reports, publications, and databases that provide benchmark data for your sector. Organizations like IBISWorld, Statista, and industry associations often publish relevant data.
Select Comparable Companies: Choose companies that are similar to yours in terms of size, market, and business model. This ensures that the benchmarks are relevant and meaningful.
Adjust for Differences: If there are significant differences between your business and the benchmarks (e.g., geographical location, scale), adjust your comparisons accordingly to maintain relevance.
Using Industry Standards and Competitor Analysis Effectively
Incorporating industry standards and competitor analysis into your financial model can provide valuable insights and improve your business strategy. Here’s how to use them effectively:
Analyze Financial Ratios: Compare your financial ratios (e.g., profit margins, return on equity) with industry averages. This helps you understand where you stand and identify areas for improvement.
Study Competitor Performance: Analyze the financial performance of your competitors. Look at their revenue growth, market share, and cost structure. This can provide insights into successful strategies and potential pitfalls.
Incorporate Best Practices: Use benchmarks to identify best practices within your industry. This can help you adopt strategies that have proven successful for others.
Present Contextual Data: When presenting your financial model to investors or stakeholders, include benchmark data to provide context. This makes your projections more credible and easier to understand.
By effectively incorporating benchmarks into your financial model, you can gain a deeper understanding of your business’s performance and make more informed decisions.
Benchmarks not only provide a point of reference but also enhance the credibility and accuracy of your financial projections.
Tools and Platforms for Financial Modeling
Having covered the core elements of a financial model, it’s essential to choose the right tools and platforms to build and manage your financial model effectively. The two most popular tools for financial modeling are Excel and Google Sheets. Each has its strengths and weaknesses, and your choice will depend on your specific business needs and preferences.
Comparison of Popular Tools (Excel vs. Google Sheets)
Both Excel and Google Sheets are powerful tools for creating financial models, but they offer different features and capabilities. Here’s a comparison of the two:
Excel:
Functionality: Excel is highly robust with extensive functionality, offering advanced features like pivot tables, complex formulas, and data visualization tools.
Customization: Excel allows for high levels of customization with VBA (Visual Basic for Applications) for creating macros and automating tasks.
Offline Access: Excel can be used offline, making it reliable when internet access is not available.
Google Sheets:
Collaboration: Google Sheets excels in real-time collaboration, allowing multiple users to work on the same document simultaneously.
Cloud-Based: As a cloud-based tool, Google Sheets ensures your data is always accessible from any device with internet access.
Integration: Google Sheets integrates seamlessly with other Google Workspace apps and various third-party applications.
Pros and Cons of Each Tool
Understanding the pros and cons of each tool can help you make an informed decision:
Excel:
Pros:
Advanced data analysis capabilities.
Extensive range of formulas and functions.
High level of customization with VBA.
Reliable offline access.
Cons:
Collaboration can be cumbersome, with issues around version control.
Software cost and licensing fees.
Heavier resource usage, which may slow down performance on large models.
Google Sheets:
Pros:
Excellent real-time collaboration features.
Free to use with a Google account.
Automatic saving and cloud storage.
Integration with other Google services and third-party tools.
Cons:
Limited functionality compared to Excel’s advanced features.
Dependency on internet access for full functionality.
Performance issues with very large datasets.
Recommendations Based on Business Needs and Preferences
Your choice between Excel and Google Sheets should be guided by your specific business requirements and preferences. Here are some recommendations:
For Advanced Data Analysis and Customization: If your financial model requires complex calculations, advanced data analysis, or custom automation, Excel is the better choice due to its robust functionality and customization options.
For Real-Time Collaboration and Accessibility: If your team needs to collaborate in real-time and access the model from various locations, Google Sheets offers superior collaboration features and accessibility.
For Cost-Effectiveness and Integration: If you are looking for a cost-effective solution with seamless integration with other tools, Google Sheets is an excellent option, especially for startups and small businesses.
In conclusion, both Excel and Google Sheets have their unique strengths and can be highly effective tools for financial modeling. By understanding the pros and cons of each, you can choose the one that best fits your business needs, ensuring you can build, manage, and present your financial model with confidence.
| Feature | Excel | Google Sheets |
|---|---|---|
| Functionality | Advanced features (pivot tables, complex formulas, data visualization) | Basic to moderate features, sufficient for most standard tasks |
| Customization | High, with VBA for macros and automation | Limited customization, no VBA support |
| Collaboration | Limited, requires sharing files, potential version control issues | Real-time collaboration, multiple users can work simultaneously |
| Access | Offline access available | Cloud-based, requires internet for full functionality |
| Integration | Integration with Microsoft Office and other applications | Seamless integration with Google Workspace and various third-party apps |
| Cost | Requires purchase/license fee | Free with a Google account |
| Performance | Handles large datasets efficiently | May struggle with very large datasets |
| Saving and Backup | Manual saving, local or cloud storage options | Automatic saving, cloud storage only |
| Data Analysis | Extensive data analysis capabilities | Basic to moderate data analysis tools |

Conclusion
Building a comprehensive financial model is a critical task for any entrepreneur looking to secure funding or plan for future growth. Throughout this guide, we've explored the essential components that make up an effective financial model, from revenue and expense projections to advanced financial statements and KPIs.
We've also discussed the importance of including benchmarks to provide context and the tools you can use to create and manage your model.
A well-constructed financial model not only helps you understand your business’s financial health but also communicates your vision and strategy to potential investors and stakeholders. By focusing on the key elements and using the right tools, you can develop a financial model that is both accurate and compelling.
Remember, the goal of your financial model is to present a clear and realistic picture of your business's potential. This involves making informed assumptions, regularly updating your data, and continuously refining your model as your business evolves.
Whether you choose Excel for its advanced features or Google Sheets for its collaboration capabilities, the most important thing is to ensure your model is thorough, precise, and tailored to your business needs.
By following the principles outlined in this guide, you can create a financial model that not only supports your business planning and fundraising efforts but also serves as a valuable tool for ongoing financial management and decision-making.
We hope this guide has provided you with the insights and tools you need to build a robust financial model. If you have any questions or need further assistance, please feel free to reach out. We’re here to help you succeed.
Key Takeaways
Accurate revenue and expense projections are essential.
Include advanced financial statements for comprehensive insights.
Use KPIs to track performance.
Benchmark against industry standards.
Choose the right tool (Excel or Google Sheets).