

Edtech Startup Valuation: The Ultimate Guide
By Lior Ronen | Founder, Finro Financial Consulting
Welcome to Finro's all-you-need-to-know guide on edtech startup valuation.
Are you curious about:
The latest transformations in the edtech world?
The money-making strategies of edtech companies?
The movers and shakers you should be keeping an eye on in the edtech scene?
How to create a comprehensive comparison analysis for edtech?
The special techniques tailored for edtech startups?
If you nodded yes to any of the above, then buckle up because this guide's got you covered.
Now, let's dive in and navigate through this edtech valuation landscape together.
- Edtech Valuation: It's about determining the worth of companies that blend technology with education, a trend accelerated by the COVID-19 pandemic.
- Market Dynamics: Involves understanding how these companies make money, the challenges they face (like regulations), and identifying key players in the industry.
- Valuation Methods: Focuses on different strategies to value edtech startups, emphasizing the need for multiple approaches to accurately assess these rapidly evolving businesses.
1. Education 2.0
2. The Shake-Up In The Edtech Landscape
- This is Not 2019 Anymore
- And Just Like That, China Changed The Rules of The Game
- These Events Are Super Relevant to Edtech Valuation
5. Edtech Comps Analysis
6. Valuation Methods For Early-Stage Edtech Startups
- Super Early Edtech Startups Valuation
- The Berkus Valuation Model
- The VC Method
- Multiples Method for Early-Stage Startups


Get your expert valuation now!
Section 1: Education 2.0
Is technology really the future of the education system?
Definitely!
But it’s also the present.
In fact, the number of software products that teachers and students access every month for educational purposes in the US increased by 40% post-covid versus pre-covid.
The days of sitting in the classroom and copying down everything your teacher says are over. Welcome to the new age!
Gone is the day when you could pass notes to your best friend in class, scribble down the answer to a problem on the corner of your homework pages, and crack open a book between classes.
Today's classrooms no longer use long textbooks but rather online resources and media. Students are required to go online to find information and write down notes.
Thanks to the wide variety of educational technology tools, teachers today have many ways to create an interactive and engaging classroom.
But there is more to edtech than virtual classrooms and engagement tools.
Corporate and personal learning constitute 75% of the edtech ecosystem.
That's many people learning Mandarin, learning how to make money managing money, re-learning that skill they had in high school, or simply refreshing their memory of when Columbus sailed to America.
The edtech market is much more fragmented than people can comprehend.
HolonIQ, an education market intelligence firm, mapped 55 different niches inside the edtech market. Each niche includes dozens of companies and technologies targeting a different audience, solving different problems in the education system through technology.
The edtech market is also sprouting like an herb garden, with more than 1,000 software vendors in the United States alone, and is expected to nearly triple in size by 2025.
This is exciting because edtech will expand from 2.7% of the education market to a share of 5.2%.

Source: HolonIQ
 |
Click to Download The Full Report Now: Finro Edtech Valuation Report 2024 |
Section 2: The Shake-Up In The EdTech Landscape
This is Not 2019 Anymore
Imagine you're in October of 2019, and someone asks you when the traditional education system will finally adopt technology on full scale.
You might say—not for another 20 years or so.
After all, educational institutions and the training industry move slowly, and the tools aren't yet proven on a mass scale.
And then, one day in March 2020, it all changed.
The change was so sudden. It was like a finger snap.
From Feb to Mar 2020, the number of learners who used technology solutions to learn, grew at least 4 times in only 30 days—from 300 million to 1.7 billion—then went even higher!
Covid certainly made a splash in the edtech industry.
Just look at what Chegg, a leading edtech company, wrote in its shareholders' letter:

Covid wasn't just a catalyst. It got everyone to understand how important edtech was and pushed the entire market a few years ahead.
In a span of three years, venture capital investment into edtech startups almost tripled.
Edtech startups raised $7.5B in VC funding in 2019, $10B in 2020 and a record $20B in 2021.

And Just Like That, China Changed The Rules of The Game
In 2020 and 2021, edtech companies worldwide experienced an extreme demand for services.
Duolingo's traffic doubled. Chegg saw a 35% increase in subscriptions. Coursera saw a five-fold increase in new learners' enrolments. Youdao increased student enrolments by 70%. Education app downloads reached 127 million in China, almost double that pre-Covid.
One year after the World Health Organization declared Covid-19 as a Pandemic and the edtech market experienced a one-of-a-lifetime surge globally, the Chinese government decided to cool down the enthusiasm in the country around edtech.
In March 2021, The local Ministry of Education announced the first wave of China edtech regulation, limiting primary and secondary school students' access to edtech platforms.
But, in July 2021, the government published the second wave of China edtech regulation barring after-school tutoring companies, including edtech companies, from earning profits, raising capital, or going public and imposing new limits on the extracurricular study.
The second wave of regulatory actions brought the hammer down on the local edtech industry.
Stock prices of Chinese edtech companies plummeted, and the IPO hopes of big players like Yuanfuado and Duoyebang disappeared at once.
These Events Are Super Relevant to Edtech Valuation
As Chegg wrote above in its shareholders' letter, it's been known for years that online education is the future of education.
The edtech market multiplied under the assumption that it would "explode." Naturally, it lacked a trigger to make that happen.
In March 2020, the pandemic instantly forced the edtech market to grow; when millions of students and teachers needed immediate technological solutions to overcome the different restrictions, they were forced to grow quickly.
Covid pushed edtech to be the big next thing in the tech sector.
Once the word "edtech" became a buzzword in the technology sector, investors went wild for educational technology companies and their stocks, driving the valuations of edtech companies through the roof.
How much?
In December 2019, a $100 investment in Chegg would have been worth $238 one year later. A similar investment in 2U would have netted you $167, TAL Education generated $153, and New Oriental Education yielded $148. These are 48% to 138% returns in one year alone.

Source: Finro analysis, based on public data
For fourteen months, edtech stocks were on top of the world, with demand at its all-time high, valuations at their peak, and opportunities finally materializing. Then July 2021 happened.
The Chinese edtech unicorns that targeted the massive potential in China and led the market suffered an unrepairable blow to their business.
The new edtech regulation in China wiped out the industry there. The collapse in valuations of Chinese edtech companies spread like a contagion, driving a sharp decline across the industry.
The $100 you invested in TAL in December 2019 and got to $153 by December 2020 was worth only $8 a year later. New Oriental Education had dropped to $17, 17Education was down to 2, and China East Education had plummeted to 31.
That free fall in Chinese edtech valuation continued into 2022.

Source: Finro analysis, based on public data
The impact on the edtech industry was massive. Valuations were affected across the market, and the high potential in the Chinese market was suddenly unobtainable by market leaders. Revenues and valuations were affected as a result.
Both public and private edtech companies were affected.
Section 3: Cash-Making Approaches of Edtech Firms
Edtech Companies Are SaaS with a Twist
Education technology companies are still software companies at heart, no matter how hard they try to convince us otherwise.
Education technology companies are essentially software companies operating in the traditional SaaS business model with minor tweaks.
There are three primary business models in the edtech niche: B2C, B2B, and C2C (marketplace).
Edtech B2C
B2C, or business-to-consumer, is the classic edtech revenue model wherein an edtech company directly sells subscriptions or paid courses to the end-user.
The best examples of B2C edtech businesses are MOOC providers. What is MOOC?
A Massive Open Online Course (MOOC) is a sizable class anyone can take online.
There are two leading types of MOOC formats: xMOOC and cMOOC.
The xMOOC format has a traditional approach to education technology. Courses in xMOOC format are based on traditional course structures and make use of established teaching approaches and materials.
Students will watch pre-recorded lectures, complete required readings, and participate in discussions as produced and curated by the course instructor or an instructional team from a higher education institution.
xMOOCs are typically self-contained and rarely if ever utilize content external to the main content delivery and learning platform.
The cMOOC format is based on connectivist learning models that privilege collaboration as a form of active learning.
Students in a cMOOC will work together to locate, evaluate, and contribute course content, uploading materials (tweets, blog posts, blogs, wikis, etc.) to the course using the learning platform.
A cMOOC instructor or instructional team facilitates learning by finalizing, aggregating, and assessing the students’ contributions to the course.
Source: Educationaltechnology.net
Edtech B2B
B2B is the good-ol’ business-to-business model. It refers to a business that sells to other companies, such as edtech companies that sell annual or monthly training plans to corporates, usually for employee training or employer-sponsored education.
B2B edtech startups can be divided between those targeting schools that want additional tools for staff and students and those targeting big corporations that want to provide online training or enrichment courses for employees.
Edtech C2C
C2C stands for Consumer-to-Consumer, a marketplace model where consumers interact and trade with each other.
A student or parent can find tutors for a specific topic in such a marketplace. So can the tutors.
Primary examples for edtech marketplaces include TurorMe, Yuanfudao, Preply, Tutor.id, Nerdy, and many more.
Section 4: Edtech Rockstars
In the last couple of years, the thirst for edtech innovations propelled more startups into the market and gave existing companies a boost.
In 2021, the education tech sector soared until it split apart in July. Chinese companies plummeted while non-Chinese companies continued to surge.
Five major American edtech companies went public in 2021 through an IPO: Coursera, Udemy, Duolingo, Nerdy, and Powerschool in one of the best years.
On the Chinese side of the market, IPO prospects, Yuanfuado and Duoyebang were forced to cancel their plans to go public in the US.
Existing publicly-traded companies TAL, New Oriental, and 17Edutation were required to revisit their trading status in the US.
Private edtech companies also experienced a stellar year in 2021, when a record number of companies became unicorns, crossing the $1B valuation market.
25 Largest Edtech Companies In The World
To help with the valuation later on, here are the top 25 largest edtech companies globally. Chinese companies are excluded from this list.
| Company | Country | Stage | Valuation |
|---|---|---|---|
| Byju's | India | Pre-IPO | 22 |
| BetterUp | United States | Series E | 4.7 |
| PowerSchool | United States | Public | 4.1 |
| Articulate | United States | Series A | 3.75 |
| CourseHero | United States | Series C | 3.6 |
| Handshake | United States | Series F | 3.5 |
| GoStudent | Austria | Series D | 3.5 |
| Unacademy | India | Series D | 3.4 |
| Duolingo | United States | Public | 3.2 |
| ApplyBoard | Canada | Series D | 3.2 |
| Emeritus | India | Series D | 3.2 |
| Outschool | United States | Series D | 3 |
| Age of Learning | United States | Series C | 3 |
| Masterclass | United States | Series F | 2.75 |
| Coursera | United States | Public | 2.15 |
| Kajabi | United States | Private | 2 |
| Stride | United States | Public | 1.8 |
| 2U | United States | Public | 1.64 |
| Udemy | United States | Public | 1.25 |
| Arco Platform | Brazil | Public | 1.07 |
| Newsela | United States | Series D | 1 |
| Vasta | Brazil | Public | 0.59 |
| Nerdy | United States | Public | 0.44 |
| Boxlight | United States | Public | 0.15 |
In the next chapters, this list will the basis of our comps analysis and valuation.
Section 5: Edtech Comps Analysis
Comps analysis, also known as the comparables analysis or competitors analysis, is the backbone of the comparables valuation.
The comparable valuation method takes a market approach to valuation and calculates the value of a company by looking at similar companies.
The list of similar companies is known as the comps analysis.
This list should include market leaders, peers, partners, and companies with a similar business model to your company's.
This technique is also known as the relative valuation, comparable company analysis (CCA), or just multiple valuations.
Comparables valuation is so great because it's a valuation model equally applicable to every business, whether it's a seed-stage startup company or a mature, profitable company.
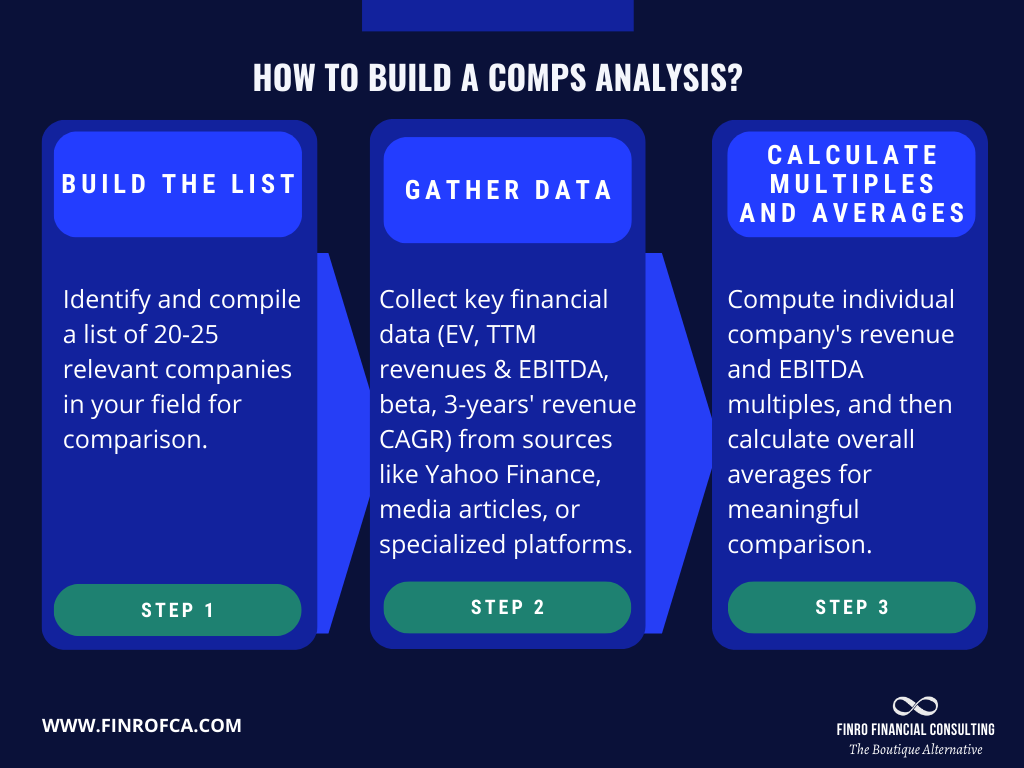
How To Build A Comps Analysis?
There are three steps to building a useful comps analysis. First, you need to develop the list of comparable companies, then gather all the required data, and finally, you can calculate multiples and averages.
Step 1: Build The List
The first and most crucial step in a comps analysis is to prepare a list of potential companies that should be considered.
These companies can be your peers, direct competitors, partners, clients, suppliers, or any company with a similar business model.
Be sure to include enough companies in your analysis, so the performance of any single company does not unduly sway your valuation.
The top priority is for direct competitors and peers. You should have at least 20 - 25 names on that list.
If you don't have so many, you can start adding more distant competitors. If that's not enough, you can use relevant partners, suppliers, and clients if they operate in the same field as you.
If even that wasn't enough, you should break your business into small pieces and find comparable companies for each piece separately. In the end, you will add all the pieces to mimic your exact business model.
In our case, we can use the list we prepared in chapter 4 above as a starting point for the analysis.
Step 2: Gathering Data
This is the tricky part.
Some of the companies on our list have publicly traded shares. You can easily find information about those companies on Yahoo Finance or Morningstar, regardless of where they are listed.
Information about privately-held companies in our list is the hard part of the research.
However, you can mostly gather the info through press releases, media articles, or paid platforms specializing in private companies' data like Capital IQ, Pitchbook, or PrivCo.
What information are we looking for anyway?
We should start with the latest enterprise value (EV), TTM (trailing twelve months), revenues & EBITDA (Earnings Before Interest, Taxes, Depreciation, and Amortization), beta, and last 3 years' revenues, CAGR (compounded Annual Growth Rate.
The EV, revenues, and EBITDA will help us in the comparables valuation. The beta will help us in the DCF valuation. The CAGR will help us put everything into perspective.
Step 3: Calculating Multiples and Averages
Once you have a table with 20-25 comparables and their relevant information, you can proceed to calculate each company's revenue multiple, EBITDA multiple, and overall averages.
First, we'll start from the individual revenues and EBITDA multiples.
Simply divide each company's valuation by its TTM or latest annual revenue to compute the EV/Revenue or revenue multiple.
Copy that calculation with the EBITDA to compute the EV/EBITDA or EBITDA multiple for each company.
You will most likely not have any EBITDA figures for the privately-held companies. We'll have only revenue multiples for these companies, and that's fine and expected.
Second, we'll aggregate all the multiples (and the betas) and calculate an overall average. This could be a simple arithmetic mean or a weighted average where each company receives a different weight. That highly depends on the case.
| Company Name | Enterprise Value (in $m) | TTM Revenue (in $m) | TTM EBITDA (in $m) | Beta | 3-Years Revenue CAGR | EV/Revenue Multiple | EV/EBITDA Multiple |
|---|---|---|---|---|---|---|---|
| EdtechCo A | 500 | 100 | 25 | 1.2 | 15% | 5.0 | 20.0 |
| EdtechCo B | 750 | 120 | 30 | 1.3 | 18% | 6.25 | 25.0 |
| EdtechCo C | 450 | 75 | 18 | 1.1 | 12% | 6.0 | 25.0 |
| EdtechCo D | 600 | 90 | N/A | 1.4 | 17% | 6.67 | N/A |
| EdtechCo E | 550 | 80 | 20 | 1.3 | 16% | 6.88 | 27.5 |
| Averages | 570 | 93 | 23.25 | 1.26 | 15.6% | 6.16 | 24.17 |
Section 6: Valuation Methods For Early-Stage Edtech Startups
There are five valuation methods—the revenue multiples, the EBITDA multiples, the discounted cash flow method, the VC method, and the Berkus model —that you can potentially use when estimating the value of your edtech startup.
To create a reliable valuation for your startup, we recommend combining at least two methods.
Each of these methods can be different from other methods, so combining them will help you get a broader notion of how much your startup is worth.
Super Early Edtech Startups Valuation
Edtech startups in the pre-seed stage and before could use either the revenues multiples we'll cover immediately below or a qualitative method that angel investors usually use.
Super early startups are typically those in the ideation phase or haven't figured out how to monetize their idea yet.
These startups can be valued either with qualitative or quantitative methods.
There are two primary qualitative valuation methods for very early-stage startups, the Berkus model and the Payne Scorecard method.
Both methods involve subjectively analyzing different aspects of your business and grading them. An overall grade is then translated into a value based on previous deals in the market or individual experience in creating such deals.
While both methods are good, the Berkus model is the leading qualitative method to value very early-stage and pre-revenue edtech startups.
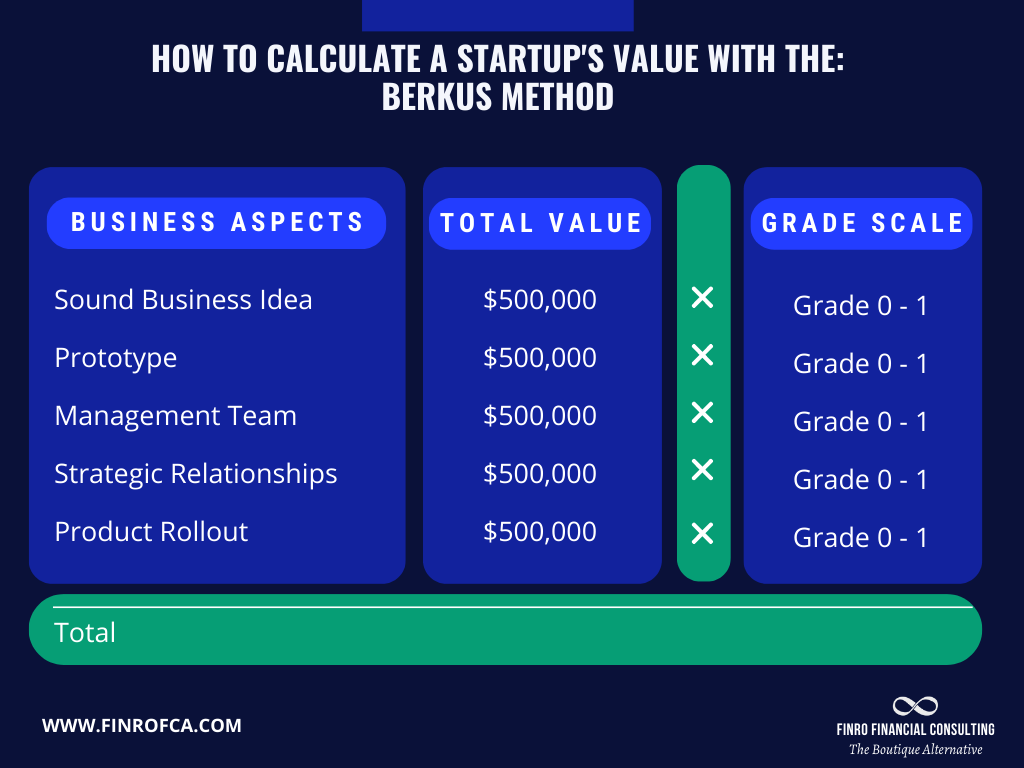
The Berkus Valuation Model
When using the Berkus model, you need to add or subtract value based on each aspect's grades, as you can see below.
If Exists: Add to Company Value up to:
1. Sound Idea (basic value, product risk) $1/2 million
2. Prototype (reducing technology risk) $1/2 million
3. Quality Management Team (reducing execution risk) $1/2 million
4. Strategic relationships (reducing market risk and competition risk) $1/2 million
5. Product Rollout or Sales (reducing financial or production risk) $1/2 million
Caveat: This method is flexible and assumes a maximum of $2.5M valuation for a pre-revenue startup.
However, the maximum value can change according to the average valuation of seed and pre-seed deals in the specific niche or location.
So using this method will require in-depth research of similar companies' valuation in their pre-seed rounds.
The leading quantitative method for super early startups is the revenue multiples method, which we cover below.
Early-Stage Edtech Startups Valuation
Early-stage edtech startups are in a slightly more advanced stage than the super early startups.
Early-stage startups are typically between pre-seed and Series A. They're mostly pre-revenues or generate tiny amounts. They have some idea of the business model and how to monetize it, even though they probably don't have all aspects of the business figured out yet.
The two leading valuation methods are the VC (venture capital) method and the revenue multiples in this stage.
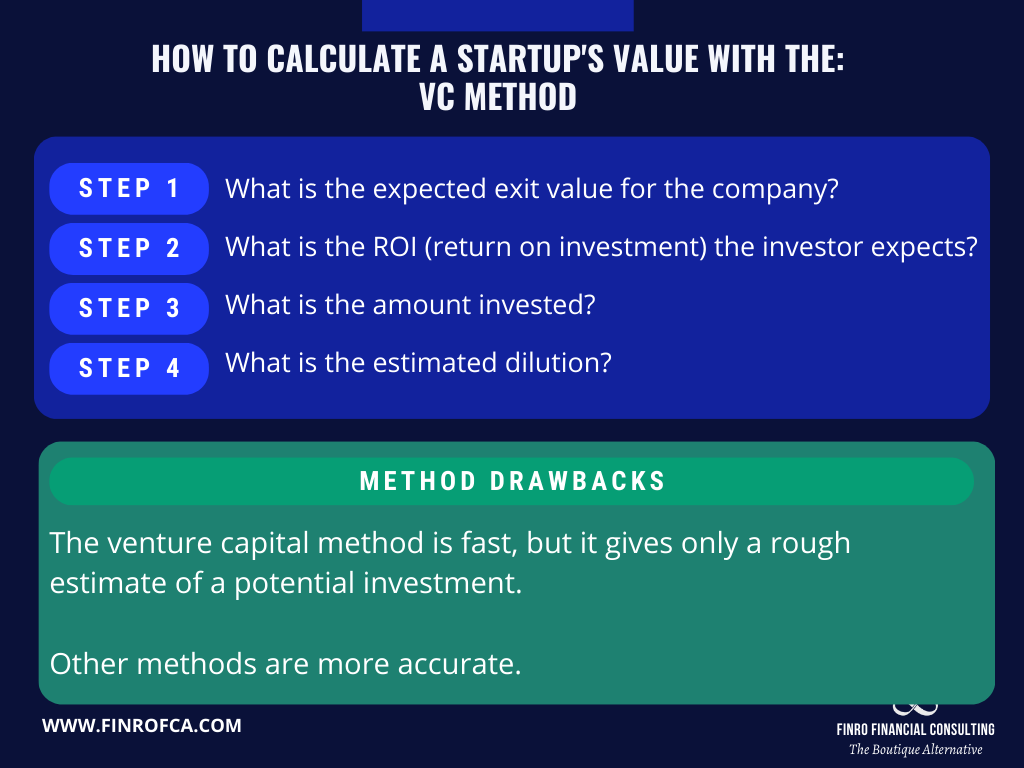
The VC Method
The VC method gives a reasonable ballpark estimate of a company's value based on expected return and previous exit multiples in the niche.
This business valuation method starts at the end with an assessment of the company's worth when it is sold.
Then, we remove layers of information to calculate the pre-revenue valuation of the startup. The pre-revenue valuation is the business's current value before any investment.
The most significant advantage of this valuation method is that it targets the rate of return - or profit - that an investor is seeking.
While not a very accurate way of estimating the valuation of a startup, the VC method considers venture capitalists' expectations.
The VC valuation method is simple and easy to perform.
Still, it requires some inputs that we can make either from our experience with similar companies, researching similar deals, or estimating.
This is the working process:
Step 1: What is the expected exit value for the company? i.e. $450M
Step 2: What is the ROI (return on investment) the investor expects? i.e., 15x
Exit Value / ROI = post-money valuation i.e. $450M / 15 = $30M
Step 3: What is the amount invested? i.e. $3M
Post-money valuation - amount invested = pre-money valuation before dilution. i.e. $30M - $30M = $27M
Step 4: What is the estimated dilution? i.e., 45%
Current pre-money valuation before dilution * (1 - estimated dilution %) = pre-money valuation after dilution. i.e. $27M * (1-0.45) = $14.85M
The venture capital method is fast, but it gives only a rough estimate of a potential investment. Revenues multiples are more accurate.
The revenue multiples method calculates the possible investment using known market values of companies with similar revenue.
Multiples Method for Early-Stage Startups
The multiples method, also known as the comparables method, is our favorite.
It provides a valuable market sense to the analysis. As mentioned above, it is easy to calculate, explain, use, and update, making it quite user-friendly.
We can apply this method to all startups. Early and late-stage—pre and post-revenues.
The revenue multiple methods include 3 steps: building a comps analysis, building a revenue forecast, and calculating the value.
Step 1: Comps analysis
The first stage is to build a comps analysis, just like we explained in chapters 4 and 5 above. That is the heart of the multiples valuation.
Step 2: Revenue Projection
The second stage is to build a revenues forecast. Typically, we use a 3 to 5 years forecast, preferably bottom-up, which is dependable and easy to explain and maintain.
What is a bottom-up revenue forecast?
It looks at the revenue forecast from the micro-level.
Under this approach, we'll forecast the user-based growth and pricing fluctuations to build an overall sales forecast.

Whether you generate revenues in a subscription model, e-commerce, or contracts-based services, your revenue forecast must include quantity and price.
In a subscription model, the quantity is the number of licenses sold in a particular period, and pricing is the monthly or annual plan.
You will have to estimate the sales volume and pricing for every revenue stream over your next few years as a company, so build out your calculations for every revenue stream in different sections.
Check out this quick run-through to learn more about building a killer revenue forecast.
Once we have our revenue forecast, we need to calculate the average annual revenues.
We prefer to do it with a weighted average where the early years receive higher weight and later years receive lower weight since accuracy probability dops with time.
Step 3: Calculating the Valuation
At the final stage, we need to multiply the annualized revenue figure from step 2 by the average revenue multiple from step 1.
Section 7: Valuation Methods For Late-Stage Edtech Startups
The two most commonly used valuation methods for late-stage edtech firms are the discounted cash flow (DCF) and the comparables method.
These methods are not suitable for everyone, nor every case.
To use the discounted cash flow model, a startup needs to have positive free cash flow right now or soon.
A startup needs to have a positive operating profit right now or soon to use the late-stage variation of the comparables method or the multiples method.
Multiples Method for Late-Stage Startups
This variation on the multiples method, which we have seen in early-stage valuation, adds a layer of data to valuations.
Previously, we used one data point in the early stage comparables valuation—the revenue multiple alone. Here, we have two data points—the revenue multiple and the EBITDA multiple. These data points improve our analysis and strengthen our results.
This process is similar to the early-stage multiples valuation we discussed above, but with two exceptions: we need to research both revenues and EBITDA for the comparable companies and build an EBITDA forecast.
This valuation requires slightly more effort than the revenues multiples method, but it is worth it.
What is EBITDA?
EBITDA refers to Earnings Before Interest, Taxes, Depreciation, and Amortization.
John Malone, an American billionaire, invented the EBITDA in the 1970s. To his thinking, the standard net profit calculation did not accurately reflect the earnings power of rapidly growing companies.
Although EBITDA is widely used in valuation and financial analysis, the US GAAP (Generally Accepted Accounting Principles) and IFRS (International Financial Reporting Standards) do not recognize it as an official reporting metric.

How to calculate the Multiples Valuation for Late-Stage Startup?
As mentioned above, This process is similar to the early-stage multiples valuation we discussed above, but with two exceptions: we need to research both revenues and EBITDA for the comparable companies and build an EBITDA forecast.
The first step is to build a comps analysis as we did above in chapter 5.
On every comparable, we need to have the latest valuation (or enterprise valuation), trailing twelve months' revenue, and EBITDA.
For the companies on our list, which are private, we won't have EBITDA figures. This is natural and expected. We'll keep it just with the valuation and revenue figures for those. It's highly valuable for the revenue multiple of the exercise.
In the second step, we'll use the EBITDA and revenue forecasts we built to calculate a representative year or annualized figure by applying a weighted average to the annual figures.
Typically we'll assign higher weights to earlier years and lower weights to the later years since accuracy probability is higher in the near future than 3 to 5 years from now.
Then, we will apply each average multiple to the respective forecast.
We'll apply the EV/Sales multiple on the weighted average of the company's revenues forecast and the EV/EBITDA multiple on the company's EBITDA forecast.

Discounted Cash Flow Method (DCF)
The discounted cash flow valuation method is notorious in the venture capital community.
To apply the DCF model a company needs to have a positive free cash flow in the present or will have soon.
That fits companies that are late-stage, mature, and have a clear business model, and a solid growth trajectory.
For early-stage edtech startups and late-stage with negative cash flow, the DCF model is not a good fit.
However, the DCF model is a powerful method to add alongside other methods in the overall valuation for startups and mature companies with positive cash flow.
There are five steps to take when building a DCF model:
Forecasting the company's financials.
Building the free cash flow.
Calculating the company's WACC or discount rate.
Adding the terminal value.
Putting it all together and creating the DCF model
The first step, building the company's financial forecast, is probably the most time-consuming activity.
There are many different ways to forecast each element in the income statement and cash flow statement. Here’s a detailed guide to building a startup financial model.
However, I want to focus on the free cash flow and the discount rate (WACC) in this guide.
Building The Free Cash Flow
There are many paths to building the company's free cash flow.
We prefer to look at Free Cash Flow = Earnings Before Interest and Taxes (EBIT) + Depreciation & Amortization + Changes in Working Capital - Capital Expenditure.
What do they all mean?
The EBIT represents the company's earnings before income and taxes are taken out of that profit.
The term "tax expenses" refers to the amount of money a company pays in taxes on corporate income.
Depreciation and Amortization are slightly (not much) more complex than the previous terms.
Depreciation and Amortization reflect an annual charge against income for the wearing out and fixed assets' obsolescence. Fixed assets are tangible or intangible assets that have been purchased for use in the business, such as equipment, buildings, or land.
The depreciation and amortization amount must be aligned to your local tax authorities requirements and International Financial Reporting Standards (the generally accepted accounting principles used by most companies).
Working capital is the difference between current assets and current liabilities. In most cases, current assets are cash, accounts receivable, and inventory. Current liabilities are accounts payable and accrued expenses. The change in working capital is the year-over-year (YoY) change in working capital.
Capital expenditures (or CapEx) are expenses spent on buying or improving fixed assets.
We can create the free cash flow forecast using all of the individual elements, which will be the foundation of our discounted cash flow model.

Building the Discount Rate
The discount rate is the rate we use to convert the future value of cash flows into the present value.
To account for the time value of money, we discount future cash flows to their present value. The discount rate is the rate at which these future cash flows are discounted.
There are a few methods to calculate a startup’s discount rate. We prefer to use the WACC formula:

What do these acronyms mean?
E = Market value of the company's equity.
D = Market value of the company's debt.
Re = Cost of equity or required rate of return.
Rd = Cost of debt. This is the debt's interest rate or yield to maturity on existing debt.
T = Tax rate
To calculate the Re, Cost of equity is calculated using the CAPM (Capital Asset Pricing Model), which equates rates of return to volatility:
Re = Rf + ERP * Beta
Where:
Rf = This is the risk-free rate in the location where the company does most of its business or raises funds. Usually, an interest rate on a government ten-year bond is used here. Information in most countries is available for free on Investing.com.
ERP= This is the equity risk premium for every country, reflecting the risk of doing business in each country. This data is available for free on Aswath Damodaran's page.
Beta: this is the correlation of the company's stock price with the stock market. However, private companies that are not publicly traded have no beta, so we use an average of their publicly traded competitors or industry average betas for free on Aswath Damodaran's page.
Adding the Terminal Value and Calculating the DCF
The terminal value represents the forecasted cash flow of the company from our projection until the end of time.
There are a few models and methods to estimate the company's terminal value.
We prefer to use the stable growth model for simplicity, assuming that the firm will grow steadily until liquidation.
So the terminal value is calculated this way:

Once we have the discount rate, free cash flow forecast, and terminal value, we can calculate the DCF using the present value formula.
We will now discount each year (and the terminal value) to the present using the discount rate we calculated above according to the PV calculation below. The company's valuation is the aggregated amount of all the present values of all the years (and the terminal value).

It's Time To Wrap it Up
That was our ultimate guide to edtech startup valuation.
Now I want to turn it over to you: what did you think about this guide? Or maybe there’s something I missed.
Let me know by leaving a comment below.
Key Takeaways
Edtech's Value Proposition: Edtech combines technology and education, a fusion accelerated by the pandemic's push for digital learning.
Rapid Market Evolution: Understanding edtech means grasping their monetization, industry challenges, and the key market players.
Diverse Valuation Techniques: Valuing edtech startups requires multiple methods to address the sector's fast-paced changes accurately.
Business Model Insights: Edtech firms employ varied SaaS-based models, targeting B2C, B2B, and C2C segments.
Methodological Approach: Both Berkus and DCF are used for valuation, tailored for the developmental stage of edtech startups.
Answers to The Most Asked Questions
-
Combine multiple methods, consider monetization models, market dynamics, and stage-specific factors for edtech valuation.
-
Tech companies are valued using metrics like revenue, growth potential, market position, and proprietary technology.
-
Startup valuation is calculated by assessing potential, market size, team, revenue forecasts, and investor expectations.
-
DCF for tech companies forecasts future cash flows discounted to present value, reflecting growth potential and risk.

